This calculator finds the z critical value from the standard normal distribution for a given significance level (α). Simply enter the significance level (in decimal form) and click the “Calculate” button.
The calculator will give you z critical values for left-tailed, right-tailed, and two-tailed tests. It will also provide you with a brief explanation of how you can obtain the value from the standard normal table.
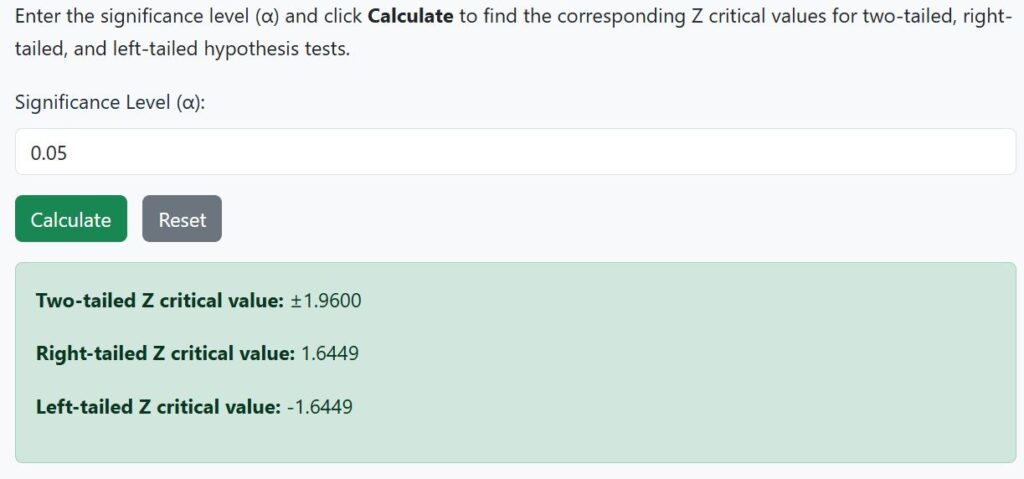
Enter the significance level (α) and click Calculate to find the corresponding Z critical values for two-tailed, right-tailed, and left-tailed hypothesis tests.
What is a Z Critical Value?
A z-critical value is a cutoff point on the standard normal distribution, which helps in determining whether the test statistic is statistically significant. In hypothesis testing, it serves as a boundary for rejecting or failing to reject the null hypothesis.
The z critical value relies on the significance level (α). For a two-tailed test, you need to divide α by 2.
Think of it as the “boundary line” for decision-making. If your test statistic falls beyond this boundary, you reject the null hypothesis. Otherwise, you fail to reject the null hypothesis.
Application of Z Critical Values in Hypotheses Testing
Want to learn how to use z-critical values in hypothesis testing, let’s go through some examples.
Example 1. Right-Tailed Test
Suppose a school wants to know if a new teaching method improves student test scores. They collected sample data, and the calculated Z statistic from the sample is 1.85. At 5% significance level, can we conclude that the new teaching method improves students’ test scores?
Solution
Step 1: State the hypotheses and identify the Type of Test
- Null hypothesis (H₀): The new teaching method does not improve scores.
- Alternative hypothesis (H₁): The new teaching method improves scores.
Since we are testing for an improvement, this is a right-tailed test.
Step 2: Choose the significance level.
From the question, we want to test the hypothesis at 5% significance level. Thus, α = 0.05
Step 3: Find the Z critical value
Using the z critical value calculator, the right-tailed critical value at α = 0.05 is 1.645.
Step 4: Compare the Z statistic to the Z critical and make the Decision
From the question, the test statistic is z = 1.85. Since the absolute value of the z test statistic (z = 1.85) is greater than the absolute z-critical value, we reject the null hypothesis, H₀.
Step 5: Make a Conclusion
At the 5% significance level, there’s sufficient evidence to conclude that the new teaching method significantly improves student test scores.
Example 2: Left-Tailed Test
Suppose a company wants to test if a new energy drink decreases reaction time in athletes. They collected sample data, and the calculated Z statistic from the sample is -1.75. At 1% significance level, can we conclude that the new energy drink reduces reaction time?
Solution
Step 1: State the hypotheses and identify the type of test
- Null hypothesis (H₀): The new energy drink does not decrease reaction time.
- Alternative hypothesis (H₁): The new energy drink decreases reaction time.
Since we are testing for a decrease, this is a left-tailed test.
Step 2: Choose the significance level
From the question, we want to test the claim at 1% level. Hence, the significance level, α = 0.01
Step 3: Find the Z critical value
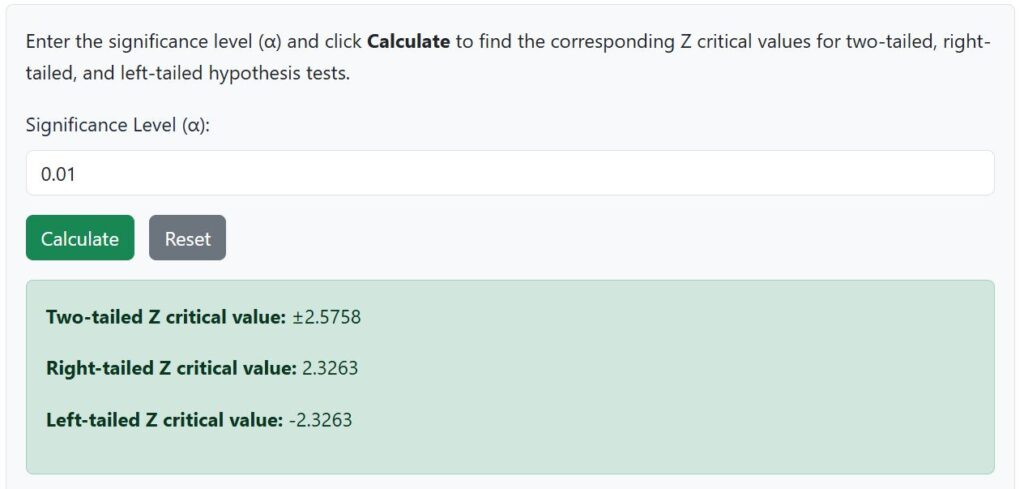
Using the Z critical value calculator, the left-tailed critical value at α = 0.01 is approximately -2.3263.
Step 4: Compare the Z statistic to the Z critical and make the decision
From the question, the z statistic is -1.75. Since the absolute value of this test statistic (1.75) is less than the absolute z-critical value (2.33), we fail to reject the null hypothesis.
Step 5: Conclusion
At the 1% significance level, there is not enough evidence to conclude that the new energy drink significantly decreases reaction time in athletes.
Example 3: Two-Tailed Test
A nutritionist wants to test whether a new diet affects the average cholesterol level of patients. The sample data yield a Z statistic of 2.10. At 10% significance level, can we conclude that the diet changes cholesterol levels?
Step 1: State the hypotheses and identify the type of test
- Null hypothesis (H₀): The new diet does not change cholesterol levels.
- Alternative hypothesis (H₁): The new diet changes cholesterol levels.
Since we are testing for any change (increase or decrease), this is a two-tailed test.
Step 2: Choose the significance level
From the scenario, we want to test the claim at 10% level. Thus, the significance level, α = 0.10
Step 3: Find the Z critical value
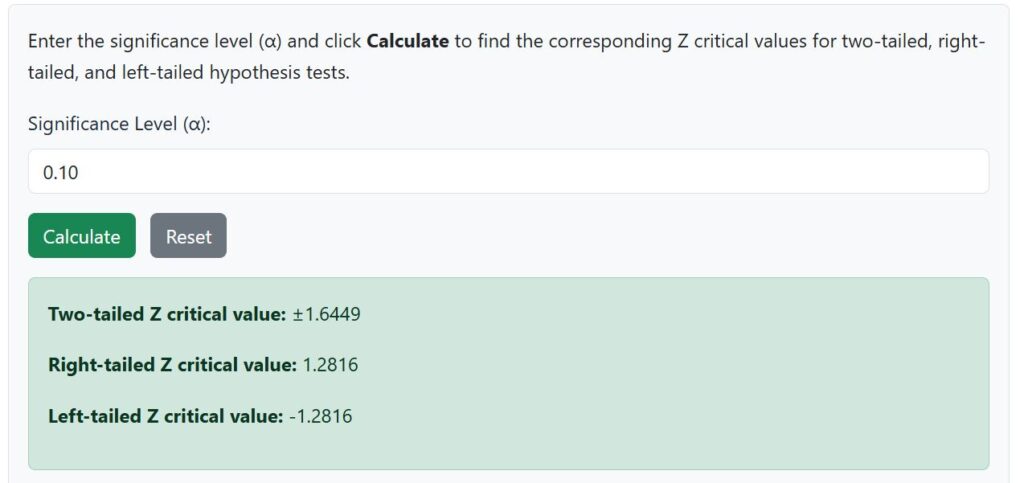
Using the Z critical value calculator, the two-tailed critical value at α = 0.10 is approximately ±1.645.
Step 4: Compare the Z statistic to the Z critical and make the decision
From the scenario, the test statistic is z = 2.10. Since the absolute test statistic value (z = 2.10) is greater than the absolute z-critical value (1.645), we reject the null hypothesis.
Step 5: Conclusion
At the 10% significance level, there is sufficient evidence to conclude that the new diet significantly affects cholesterol levels.
Frequently Asked Questions
A Z critical value is a cutoff point on the standard normal distribution that helps determine whether to reject the null hypothesis in a statistical test. It depends on your chosen significance level (α) and the type of test (two-tailed, left-tailed, or right-tailed).
Enter your desired significance level (α) in decimal form and click Calculate. The calculator will display the Z critical values for two-tailed, right-tailed, and left-tailed tests, along with a step-by-step explanation.
– Use a right-tailed test when testing if a value increases (e.g., improvement in test scores).
– Use a left-tailed test when testing if a value decreases (e.g., reduction in reaction time).
– Use a two-tailed test when testing for any difference, increase, or decrease (e.g., effect of a diet on cholesterol levels).
Yes! Z critical values are also used to calculate confidence intervals. For example, a 95% confidence interval uses a two-tailed Z critical value of ±1.96 to determine the range in which the population parameter is likely to fall.