
How to Use the Proportion Confidence Interval Calculator
This calculator lets you find a confidence interval for a single population proportion using either summary data or count data. To find the proportion confidence interval from summary data such as sample proportion (p̂), sample size (n), and confidence level, follow these steps:
- Select the Summary Data option
- Enter the sample proportion (p̂) as a decimal.
- Enter the sample size (n)
- Enter the confidence level as an integer (e.g., 95 for 95% confidence level, 88 for 88% confidence level, etc.).
- Select the number of decimal places for your answer
- Click calculate
However, if you only have count data (number of successes (x) and total sample size (n)), you don’t have to compute the sample proportion (p̂). Just follow these steps:
- Select the Count Data option
- Enter the number of successes (x)
- Enter the sample size (n)
- Enter the confidence level as an integer (eg., 99 for 99% level, 96.5 for 96.5% level, etc.)
- Select the number of decimal places for your answer.
- Click Calculate.
The calculator will instantly return the correct confidence interval rounded to your preferred decimal places. It will also show you a complete step-by-step solution, explaining how to find the confidence interval for a single proportion manually.
Want to a tool that performs the hypothesis test instead? Use the one-proportion test calculator.
What Is a Confidence Interval for a Population Proportion?
A confidence interval for a population proportion is a range of values, calculated from sample data, that is likely to contain the true percentage or fraction of an entire population with a specific characteristic.
For example, suppose a random sample of college students gives a sample proportion of p̂ = 0.64. If a 95% confidence interval for the sample proportion is 95% CI = [0.5805, 0.6995], we can be 95% confident that the true population proportion is between approximately 0.5805 and 0.6995, or between 58.05% and 69.95%.
Confidence Interval formula (Population Proportion)
The confidence interval formula for a single population proportion is:
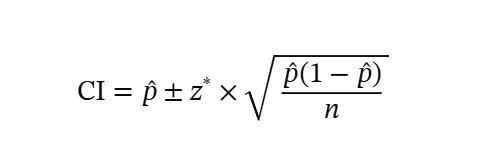
Where:
- CI is the confidence interval
- p̂ is the sample proportion
- z* is the z critical value for the selected confidence level
- n is the sample size
- √[p̂(1 − p̂) / n] is the standard error of the sample proportion
Note. z* × √[p̂(1 − p̂) / n] is also called the margin of error (ME), and the confidence interval formula for a proportion is sometimes written as: CI = p̂ ± ME
How to Calculate a Confidence Interval for a Proportion
To calculate a confidence interval for a population proportion by hand, follow these steps:
- Identify the sample proportion, sample size, and confidence level. If you are given the number of successes instead of p̂, first calculate p̂ = x/n.
- Find the z critical value.
- Apply the confidence interval formula.
Example 1: Confidence Interval for a Proportion Using Summary Data
A university registrar wants to estimate the proportion of undergraduate students who plan to enroll in at least one summer course. From a random sample of 250 students, the sample proportion is 0.64. Construct a 95% confidence interval for the true proportion of undergraduate students who plan to enroll in a summer course.
Solution
To find the 95% confidence interval manually, follow these steps:
Step 1. Identify the given parameters
From the question, we know that:
- Sample proportion, p̂ = 0.64
- Sample size, n = 250
- Confidence level = 95%
Step 2. Find the z-critical value
For a 95% confidence level, the corresponding z-critical value is z* = 1.959964 using the z-critical value calculator. However, if you’re using a standard normal table, this is usually rounded to 1.96.
Step 3. Apply the formula
By definition, the confidence interval formula for a single population proportion is: CI = p̂ ± z* × √[p̂(1 − p̂) / n]
Substituting the values into the formula, we get:
CI = 0.64 ± 1.959964 × √[0.64(1 − 0.64) / 250]
= 0.64 ± 1.959964 × √0.0009216
= 0.64 ± 1.959964 × 0.030358
Hence, CI = 0.64 ± 0.059500
Note. In some cases, you can report the answer as above. However, in most cases, you need to evaluate the above expression to find the actual values for the lower and upper confidence limits.
Therefore,
- Lower confidence limit: 0.64 − 0.059500 = 0.580500
- Upper confidence limit: 0.64 + 0.059500 = 0.699500
Rounding the confidence interval to 4 decimal places, we get: 95% CI = [0.5805, 0.6995].
Thus, we are 95% confident that the true proportion of undergraduate students at the university who plan to enroll in at least one summer course is between 0.5805 and 0.6995.
Verify Example 1 Using the Calculator
To verify the result using our proportion confidence interval calculator:
- Select Summary Data.
- Enter
0.64for the sample proportion. - Enter
250for the sample size. - Enter
95for the confidence level. - Select 4 Decimal Places
- Click Calculate.
The calculator will instantly return: 95% CI = [0.5805, 0.6995]. It will also show you how to get the same results step-by-step.
Example 2: Confidence Interval for a Proportion Using Count Data
A university career center randomly samples 300 graduating seniors. Of those surveyed, 147 have already accepted a full-time job offer. Construct a 90% confidence interval for the true proportion of graduating seniors who have accepted a full-time job offer.
Solution
To find the 90% confidence interval manually, follow these steps:
Step 1. Identify the given parameters
From the question, we know that:
- Number of successes, x = 147
- Sample size, n = 300
- Confidence level = 90%
As you can see, we are not given the sample proportion (p̂), which is needed when computing the confidence interval. Thus, we need to estimate p̂ from the given information.
By definition, the sample proportion, p̂ = x/n
Substituting the values, we get: p̂ = 147/300
= 0.49
Step 2. Find the z-critical value
To find the z-critical value for a 90% confidence level, you can either use a z-critical value calculator or a z-table. Using the calculator, the z-critical value, z* = 1.644854. However, using a z-table, the value is 1.645.
Step 3. Apply the formula
Since we now have all the required parameters to calculate the confidence interval, we only need to substitute these values into the formula.
Substituting the values into the formula, we get:
CI = 0.49 ± 1.644854 × √[0.49(1 − 0.49) / 300]
= 0.49 ± 1.644854 × √0.000833
= 0.49 ± 1.644854 × 0.028862
Hence, CI = 0.49 ± 0.047473
Calculating the lower and upper confidence limits, we have:
- Lower confidence limit: 0.49 − 0.047473 = 0.442527
- Upper confidence limit: 0.49 + 0.047473 = 0.537473
We can then round the result to 4 decimal places. Thus, the 90% CI = [0.4425, 0.5375]. This means that we are 90% confident that the true proportion of graduating seniors who have accepted a full-time job offer is between 0.4425 and 0.5375.
Verify Example 2 Using the Calculator
To verify the result using our one-proportion confidence interval calculator:
- Select Count Data.
- Enter
147for the number of successes. - Enter
300for the sample size. - Enter
90for the confidence level. - Select 4 Decimal Places
- Click Calculate.
The calculator will instantly return the 90% confidence interval as: 90% CI = [0.4425, 0.5375] and show you how the value was computed.
How to Interpret a Confidence Interval for a Proportion
A confidence interval should be interpreted in terms of the population proportion, not the sample proportion.
Suppose you calculate: 95% CI = [0.42, 0.50]
A suitable interpretation is:
We are 95% confident that the true population proportion is between 0.42 and 0.50.
If the proportion represents the percentage of U.S. college students who work while attending school, you could write:
We are 95% confident that between 42% and 50% of all students in the population represented by the sample work while attending college.
The confidence level describes the long-run performance of the method. If many random samples were taken and a 95% confidence interval were constructed from each sample in the same way, approximately 95% of those intervals would contain the true population proportion.
Avoid saying there is a “95% probability” that the fixed population proportion lies inside the particular interval you already calculated. The usual frequentist confidence interval interpretation is about the reliability of the procedure used to construct the interval.
When Can You Use a One-Proportion Z Confidence Interval?
This calculator is specifically designed for the one-proportion z confidence interval, which is useful when the normal-approximation conditions are satisfied.
Thus, to use the calculator, the following conditions must be satisfied:
- The outcome should have two independent categories
- The observations should be independent
- The normal approximation condition must be met (i.e., n × p̂ ≥ 10 and n × (1 − p̂) ≥ 10)
If the normal approximation condition is not met (sample is small or p̂ is very close to 0 or 1), you should use other methods such as Wilson score interval or the exact binomial method.
Frequently Asked Questions
A proportion confidence interval calculator estimates a range of values that is likely to contain the true population proportion based on sample data. This calculator accepts either summary data or count data and return any confidence interval using the normal approximation method. It also shows you a clear, step-by-step solution of how the confidence interval was obtained.
This calculator uses the normal approximation, also called the one-proportion z confidence interval, to estimate a confidence interval for a single population proportion.
You can enter either summary data using the sample proportion and sample size, or count data using the number of successes and sample size.
The calculator uses the formula: CI = p̂ ± z* × √[p̂(1 − p̂) / n], where p̂ is the sample proportion, z* is the z-critical value, and n is the sample size.
No. This calculator estimates the confidence interval for one population proportion. Comparing two independent proportions requires a confidence interval for the difference between two proportions.
The calculator displays a warning because the z confidence interval may be less reliable. For small samples or very few successes or failures, a method such as the Wilson score or exact binomial interval may be more appropriate.
