
How to Use the Margin of Error Calculator
This calculator allows you to estimate the margin of error for a survey with either a known finite population or a very large or unknown population. To use the calculator:
- Enter the sample size (n).
- Enter the confidence level as an integer. You can either enter the common confidence levels such as 90%, 95%, and 99% or enter a custom value.
- Enter the estimated proportion (p) as a decimal. For example, enter
0.6for 60%. - Enter the population size (N) if it is known. You can leave this field blank if the population is unknown or very large.
- Click Calculate.
The calculator will instantly return the margin of error as a percentage and show you how the value was obtained, step-by-step.
Unsure what expected proportion to use? Use p = 0.5 because it gives the largest margin of error, which is the safest when planning a survey.
Already know the margin of error you want and need to determine how many people to survey? Use our Cochran’s Formula Calculator to calculate the minimum sample size for your survey and see the steps.
What Is Margin of Error?
Margin of error (MOE) is a statistical measure that tells us how much a sample estimate varies from the true population value. It is mainly written using a plus-minus sign (±) to indicate the range within which the true population parameter is expected to fall.
For instance, suppose a survey finds that 58% of customers prefer a new product and reports a margin of error of ±4%. This implies that the true percentage of the entire customer population who prefer the new product likely falls between 54% and 62% (calculated as 58% minus 4% and 58% plus 4%) at a given confidence level.
Margin of Error Formula
The margin of error formula for surveys uses the sample proportion as an estimate for the population proportion. It calculates the maximum expected random variation using a critical Z-score and standard error for proportion.
Therefore, the margin of error formula is:

Where:
- MOE is the margin of error
- z* is the z critical value for the selected confidence level
- p is the estimated proportion
- n is the sample size
Tip. The 1-p is sometimes denoted by q and represents the proportion that does not have the characteristics of interest.
The z-critical values for the most common confidence levels are summarized in the table below.
| Confidence Level | z Critical Value |
|---|---|
| 90% | 1.645 |
| 95% | 1.960 |
| 99% | 2.576 |
Do you want to use a confidence level different from the above? Use our z-critical value calculator and select the two-tailed critical value.
How to Calculate Margin of Error when Population Size is Unknown or Infinite
To find the margin of error for a survey proportion when the population size is Unknown or Infinite, follow these steps:
- Find the z-critical value (Z*) for your confidence level
- Calculate the standard error of the proportion
- Multiply the critical value by the standard error to find the margin of error
Example 1: Finding MOE When Population Size Is Unknown or Infinite
A U.S. grocery chain surveys 600 customers to estimate the proportion who prefer curbside pickup. Among the customers surveyed, 58% prefer curbside pickup. Calculate the margin of error at a 95% confidence level.
Solution
From the question, we know that:
- Sample size, n = 600
- Confidence level = 95%
- Estimated proportion, p = 0.58
- Population size is not given
Since the population size is not provided, we assume that it is infinite.
To find the margin of error, follow these steps:
Step 1. Find the z-critical value (Z*)
To get the z-critical value for a 95% confidence level, we need to use a z-table and look up z(1-0.95)/2. That is, we need to find the z-score that corresponds to a cumulative probability of 0.975 (or an alpha tail area of 0.025)
This gives Z* = 1.96, which is obtained by combining the row value and column value of 0.975 highlighted in the table below.
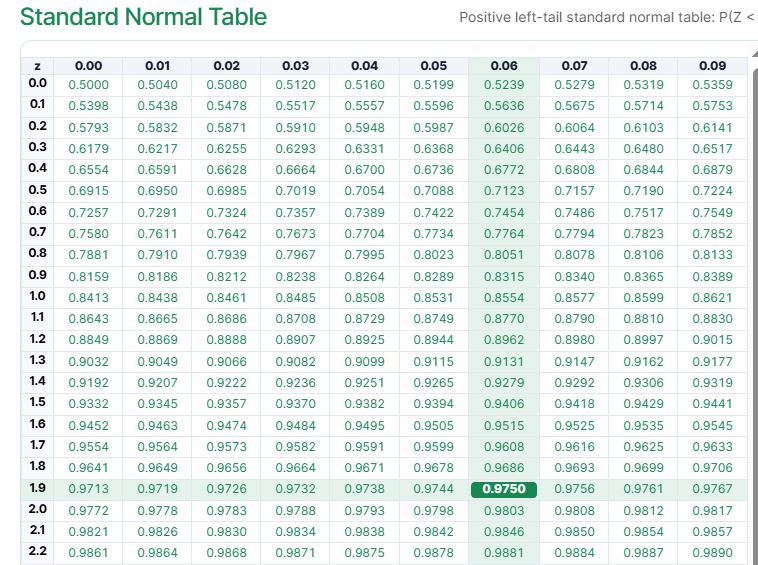
You can also quickly find this critical value using the z-critical value calculator by simply entering a 0.05 significance level and selecting a two-tailed z-critical value.
Step 2. Find the standard error
By definition, the standard error formula for a survey proportion is: SE = √[p(1 − p) / n]
Substituting the values into the formula, we get:
SE = √[0.58(1 − 0.58) / 600]
= √0.000406
= 0.02015
Step 3. Multiply the standard error by the z-critical value (Z*)
Recall. The margin of error formula for an infinite or unknown population is: MOE = z* × √[p(1 − p) / n], where Z* is the z-critical value and √[p(1 − p) / n] is the standard error.
Since we know the standard error, SE = 0.02015, and Z* = 1.96, we can calculate the margin of error as follows:
MOE = Z* x SE
= 1.96 x 0.02015
= 0.0395
Converting this to a percentage and adding a plus-minus sign, we get: MOE = ±3.95%. This implies that the reported survey proportion of 58% has a sampling margin of error of approximately 3.95 percentage points at the 95% confidence level.
Example 1 Verification using the Calculator
To verify the results in Example 1 using our margin of error calculator, follow these steps:
- Enter the sample size as
600 - Enter the confidence level as
95for a 95% confidence level - Enter the estimated proportion as
0.58 - Leave population size blank
- Click Calculate.
The calculator will instantly return the margin of error as: Margin of Error = ±3.95%. You’ll also see a clear step-by-step explanation of how the value was computed.
Margin of Error Formula for a Finite Population
Sometimes the total population is known, and the sample represents a noticeable part of that population. For instance, beyond knowing the sample size (n) and expected proportion (p), you might also have information on the size of the target population (N). In this case, we need to adjust the margin of error formula to account for known population size by applying the finite population correction factor.
Therefore, the margin of error formula for a finite population becomes:
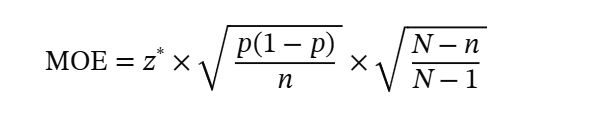
Where:
- N is the known/finite population size
- n is the sample size
From the formula, √[(N − n) / (N − 1)] is the finite population correction (FPC) factor. The FPC reduces the margin of error because a sample containing a large share of the entire population provides more information than the same-sized sample drawn from a much larger (infinite) population.
Tip. If the known population is very large relative to the sample (say N ≥ 100,000), the adjustment has little to no effect. That is why the population-size field in our calculator is optional.
How to Calculate Margin of Error for Finite/Known Population
To find the margin of error for a known and finite population, follow these steps:
- Find the z critical value (z*)
- Find the standard error of the expected proportion (SE)
- Calculate the finite population correction (FPC)
- Multiply the results in steps 1, 2, and 3
Example 2: Finding Margin of Error with a Known (Finite) Population Size
A school district has 1,200 high school seniors. The district randomly surveys 300 students and finds that 40% plan to attend a community college after graduation. Find the margin of error at a 95% confidence level.
Solution
From the question, we know that:
- Sample size, n = 300
- Population size, N = 1,200
- Estimated proportion, p = 0.40
- Confidence level = 95%
Since the population size is known and finite, we need to adjust the margin of error using the finite population correction.
Therefore, to find the margin of error when the population size, N = 1200, follow these steps:
Step 1. Find the z-critical value (Z*)
From Example 1, we know that the z-critical value for a 95% confidence level is: Z* = 1.96
Step 2. Find the standard error
The standard error formula for a survey proportion is:
SE = √[p(1 − p) / n]
Substituting the values into the formula gives:
SE = √[0.40(1 − 0.40) / 300]
= √0.0008
= 0.02828
Step 3. Calculate the finite population correction (FPC)
Since the population size is known, we calculate the finite population correction using:
FPC = √[(N − n) / (N − 1)]
Substituting the population size and sample size gives:
FPC = √[(1,200 − 300) / (1,200 − 1)]
= √(900 / 1,199)
= 0.86639
Step 4. Multiply the z-critical value, standard error, and finite population correction
For a known finite population, the margin of error formula is:
MOE = Z* × SE × FPC
We already know that:
- Z* = 1.96
- SE = 0.02828
- FPC = 0.86639
Substituting the values into the formula, we get:
MOE = 1.96 × 0.02828 × 0.86639
= 0.04803
Converting this value to a percentage and adding a plus-minus sign gives: MOE = ±4.80%. This implies that the estimated proportion of 40% has a sampling margin of error of approximately 4.80 percentage points at the 95% confidence level.
Example 2 Verification Using the Calculator
To verify the result in Example 2 using our margin of error calculator, follow these steps:
- Enter the sample size as
300. - Enter the confidence level as
95. - Enter the estimated proportion as
0.40. - Enter the population size as
1200. - Click Calculate.
The calculator will automatically apply the margin of error formula for a finite population and return: Margin of Error = ±4.80%. You’ll also see a clear step-by-step explanation showing how the standard error and finite population correction were used to calculate the final margin of error.
How to Interpret Margin of Error
The margin of error tells you how far the survey estimate may reasonably vary because the result is based on a sample rather than the entire population. A smaller margin of error means a more precise estimate, while a larger margin of error means less precision.
For example, suppose a survey finds that 62% of respondents support a proposal with a margin of error of ±3.5% at the 95% confidence level.
The result can be written as: 62% ± 3.5 percentage points
Thus, the lower limit is: 62% − 3.5% = 58.5%, while the upper limit is: 62% + 3.5% = 65.5%
Therefore, the survey estimate ranges from approximately 58.5% to 65.5%. In this case, the margin of error is the distance from the estimated proportion of 62% to either end of the interval.
When interpreting survey proportions, it is more accurate to say percentage points rather than percent. For example, the difference between 62% and 65.5% is 3.5 percentage points.
Remember. The margin of error describes sampling uncertainty. It does not account for other possible survey problems such as an unrepresentative sample, nonresponse, or poorly worded questions.
What Is a Good Margin of Error?
There is no single margin of error that is suitable for every study. However, a smaller margin gives a more precise estimate, but achieving that precision normally requires a larger sample.
In many general surveys, a margin of error around ±5 percentage points may provide adequate precision. On the other hand, large public opinion polls often aim for margins closer to ±3 percentage points, while studies requiring very precise estimates may need an even smaller margin.
Therefore, the correct value depends on:
- how the results will be used,
- how much precision the research question requires,
- the available population,
- the cost of collecting additional responses, and
- the consequences of making a decision from an imprecise estimate.
Frequently Asked Questions
A margin of error calculator estimates the sampling uncertainty around a survey proportion. This calculator uses the sample size, confidence level, and estimated proportion to calculate the margin of error. You can also enter a known population size to automatically apply the finite population correction.
The margin of error formula depends on whether the population size is unknown or very large, or whether you are sampling from a known finite population. If the population is unknown or very large (infinite), the formula is: MOE = z* × √[p(1 − p) / n]. However, if the population is infinite, we adjust the formula using the finite population correction. Thus, the adjusted formula becomes: MOE = z* × √[p(1 − p) / n] × √[(N − n) / (N − 1)].
Where:
– MOE is the margin of error
– z* is the z-critical value for the selected confidence level
– p is the estimated proportion
– n is the sample size
– N is the population size
Use p = 0.5 when you do not have a reasonable estimate because it produces the largest margin of error, thus giving you the most conservative result. However, if you have an estimate from previous research, a pilot study, or your sample, use that proportion instead.
A larger sample size decreases the margin of error, while a smaller sample size increases it. In general, larger samples give more precise estimates.
Population size mainly affects the margin of error when the sample makes up a noticeable share of the population. For large populations, its effect is usually small.
A higher confidence level increases the margin of error, while a lower confidence level decreases it. For example, a 99% confidence level produces a larger margin of error than a 95% confidence level.
