
How to Use the Stem and Leaf Plot Calculator
This stem and leaf plot calculator helps you to quickly create a stem-and-leaf plot directly from your numerical data. You do not need to sort the values or decide which digits should be the stems and leaves. The calculator does it for you. This makes it perfect for quickly verifying your results or when preparing for a timed AP Statistics or Math exam.
To use the calculator:
- Enter your data values in the Data Values box. You can separate the numbers using commas, spaces, tabs, or line breaks. Alternatively, you can also paste values directly from Excel, Google Sheets, or text documents.
- Add a plot title if you want to give your stem-and-leaf plot a specific name.
- Click Calculate.
The calculator will instantly return the correct stem and leaf plot for your data, which you can copy-paste to your Word document. The tool also provides a clear, step-by-step solution, showing you exactly how the stem-and-leaf plot was created from your own data. This is meant to ensure you not only get the correct graph but also learn how to create the plot for future exam preparation.
What Is a Stem and Leaf Plot?
A stem and leaf plot, also called a stem-and-leaf display or stemplot, is a way of organizing numerical data that shows both the individual values and the overall distribution of the data.
Each value is divided into a stem and a leaf.
- The stem contains the leading digit or digits.
- The leaf contains the final digit.
For example, suppose the value is 47. It can be written as: 4 | 7. In this case, 4 is the stem, and 7 is the leaf.
If several values have the same stem, their leaves are written together in ascending order. For example: 4 | 1 3 7 8 represents: 41, 43, 47, 48
This is what makes a stem-and-leaf plot useful. Unlike many other graphs, it shows the shape of a dataset without hiding the original values.
How to Make a Stem and Leaf Plot
To create a stem-and-leaf plot manually:
- Arrange the data in ascending order (from smallest to largest).
- Separate each value into stem and leaf
- Group the Leaves by Stem to form the stem-and-leaf plot
- Add a Key
Example 1. Creating a Stem-and-Leaf Plot Manually
A statistics student collects data on the number of minutes it takes 12 classmates to complete a math puzzle. The raw data values are shown below:
14, 27, 22, 34, 18, 42, 31, 25, 39, 34, 21, 46
Find the correct stem-and-leaf plot for the data.
Solution
To create a stem-and-leaf plot for the data by hand, follow these steps:
Step 1: Arrange the Data in Order
Start by sorting the values from smallest to largest. After arranging the values in ascending order, we get:
14, 18, 21, 22, 25, 27, 31, 34, 34, 39, 42, 46
Step 2: Separate Each Value Into a Stem and Leaf
For these two-digit whole numbers, use the tens digit as the stem and the ones digit as the leaf. Separating each value into a stem and leaf, we get:
- 14 → 1 | 4
- 18 → 1 | 8
- 21 → 2 | 1
- 22 → 2 | 2
- 25 → 2 | 5
- 27 → 2 | 7
- 31 → 3 | 1
- 34 → 3 | 4
- 34 → 3 | 4
- 39 → 3 | 9
- 42 → 4 | 2
- 46 → 4 | 6
Step 3: Group the Leaves by Stem
To group the leaves by stem, we place values beginning with the same stem on the same row. This leads to the following stem-and-leaf plot.
| Stem | Leaves |
|---|---|
| 1 | 4 8 |
| 2 | 1 2 5 7 |
| 3 | 1 4 4 9 |
| 4 | 2 6 |
Note. Repeated values remain in the plot. Since 34 occurs twice, the leaf 4 appears twice beside stem 3.
Step 4: Add a Key
A stem-and-leaf plot should always include a key because the same notation can represent values of different sizes.
For this example, we can have the key as: Key: 2 | 5 = 25. The key tells us that stem 2 with leaf 5 represents the value 25.
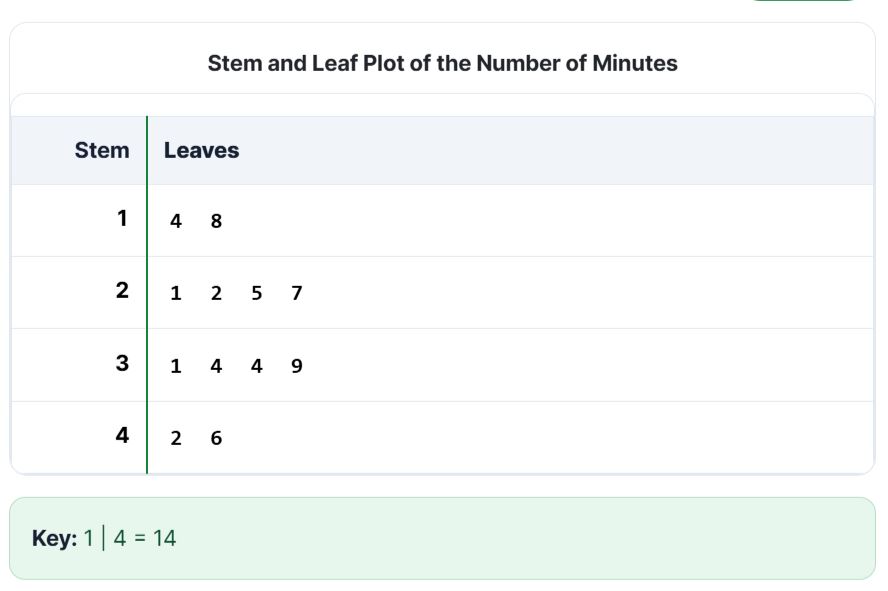
Example 2. Creating a Stem-and-Leaf Plot using the Calculator
To create the stem-and-leaf plot for the Example 1 data using the calculator, follow these steps:
- Copy and paste the data values into the input field
- Type “Stem and Leaf Plot of the Number of Minutes” as the plot title
- Click Calculate
The calculator will instantly return the following stem-and-leaf plot.
How to Read a Stem and Leaf Plot
Reading a stem-and-leaf plot involves looking at a chart that splits numbers into a leading “stem” (usually the tens or hundreds place) and a trailing “leaf” (the ones place). To read the plot, follow these simple steps:
- Check the key provided to see what place values the stem and leaf represent.
- Read the stems by looking at the numbers listed in the left column.
- Read the leaves by looking across the row to the right of each stem to see the final digits.
- Join the left stem number with each leaf in that row to recreate the original data list
Example 3. Reading a Stem and Leaf Plot
Suppose you are given the following stem-and-leaf plot:
| Stem | Leaves |
|---|---|
| 2 | 3 6 9 |
| 3 | 1 4 7 |
| 4 | 0 2 5 8 |
Key: 3 | 4 = 3.4
Find the actual values used to create the plot.
Solution
To read the stem and leaf plot, follow these steps:
Step 1: Check the key.
The key shows how the stem and leaf combine to form a data value. In this case, the key is: 3 | 4 = 3.4. This means the stem represents the whole-number part and the leaf represents the tenths digit.
Step 2: Read the stems.
The stems are the numbers in the left column. In this example, 2, 3, and 4 are the stems and represent the values in the 2s, 3s, and 4s.
Step 3: Read the leaves.
Now look at the leaves listed to the right of each stem:
- Stem 2 has leaves 3, 6, 9
- Stem 3 has leaves 1, 4, 7
- Stem 4 has leaves 0, 2, 5, 8
Step 4: Join each stem with its leaves.
Use the key to combine each stem with every leaf in its row. Therefore:
- 2 | 3 6 9 represents 2.3, 2.6, 2.9
- 3 | 1 4 7 represents 3.1, 3.4, 3.7
- 4 | 0 2 5 8 represents 4.0, 4.2, 4.5, 4.8
Therefore, the original data values are: 2.3, 2.6, 2.9, 3.1, 3.4, 3.7, 4.0, 4.2, 4.5, 4.8
What Does a Stem and Leaf Plot Show?
A stem-and-leaf plot does more than put numbers into rows. The lengths and positions of the rows provide a quick picture of the distribution.
You can use the plot to examine:
- Where the Data Are Concentrated. Rows with many leaves show ranges containing more observations. If most leaves occur around the middle stems, the data are concentrated around that part of the distribution.
- The Spread of the Data. The distance from the smallest observation to the largest gives an immediate impression of the spread. However, if you need numerical measures such as the range, variance, quartiles, or standard deviation rather than a visual display, use the descriptive statistics calculator.
- Gaps. A stem with no leaves indicates that no observations occur within that portion of the data.
- Possible Outliers. A value positioned well away from the rest of the observations may be unusual.
Note. Although a stem-and-leaf plot can help you identify possible outliers, it may not be effective because identifying an observation formally as an outlier usually requires a rule such as the interquartile range method.
Frequently Asked Questions
A stem and leaf plot calculator converts a list of numerical values into a stem-and-leaf display. This calculator sorts the data, determines the stems and leaves, groups the leaves in order, creates a key, and provides a step-by-step explanation of how the plot was constructed.
Yes. You can enter decimal values directly. The calculator automatically uses the precision of the entered data to determine how the values should be divided into stems and leaves and generates a key showing how to interpret the result.
No. Enter the values in any order. The calculator automatically sorts them from smallest to largest before constructing the stem-and-leaf plot.
Its main advantage is that it shows the distribution of the data while preserving the actual observations. You can see where values are concentrated, identify gaps or unusual observations, and still recover every individual data value from the plot.
