
How to Use the Covariance Calculator
This calculator helps you find the covariance between two paired variables for sample or population data. To use the calculator:
- Choose Sample or Population.
- Enter the X values in the first input box.
- Enter the matching Y values in the second input box.
- Click Calculate.
The calculator will instantly return the correct covariance value depending on the covariance type you selected. That is to say, if you select sample, you’ll get sample covariance. However, if you select population, you’ll get population covariance.
Want to learn how to compute covariance using your own data? The calculator goes beyond the final answer and shows you exactly how to compute sample/population covariance manually.
Note. To get the correct covariance, make sure the data are paired correctly. In other words, the first X value should match the first Y value, the second X value should match the second Y value, and so on.
Want to find sample or population variance instead? Use the variance calculator.
What Is Covariance?
Covariance is a statistical measure that tells you the extent to which two variables change together. If these variables move in the same direction, then we have a positive covariance. However, if the two variables move in opposite directions, they are said to have a negative covariance.
Covariance is useful because it shows the direction of the relationship between two variables. However, its size depends on the units of measurement. As such, it is not always easy to compare covariance values across different datasets.
Tip. A covariance close to zero suggests that the two variables do not show a clear linear pattern of moving together.
Covariance Formula
The two main types of covariance are: Sample covariance and population covariance. As such, the correct covariance formula to use depends on whether the paired data is from a sample or the entire population.
If the paired data are from a sample, you should use the following sample covariance formula:
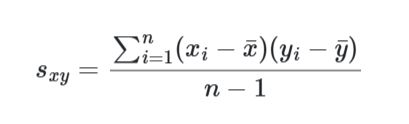
Where:
- sxy is the sample covariance.
- xᵢ is the ith X value.
- yᵢ is the ith Y value.
- x̄ is the sample mean of X.
- ȳ is the sample mean of Y.
- n is the number of paired observations.
- Σ means add all the products of deviations.
However, if you’re working with paired data from the entire population, you should use the population covariance formula below.
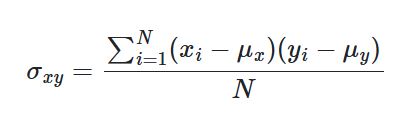
Where:
- σxy is the population covariance.
- xᵢ is the ith X value.
- yᵢ is the ith Y value.
- μx is the population mean of X.
- μy is the population mean of Y.
- N is the total number of paired values in the population.
- Σ means add all the products of deviations.
Note. The only difference between the population covariance formula and sample covariance formula is the denominator. Specifically, for the sample covariance formula, we divide the product of the deviations from the sample mean by n-1, whereas for the population covariance formula, we divide the product of the deviations from the population mean by N (total number of observations in the population).
How to Calculate Covariance
Calculating covariance between two paired variables involves finding each X value’s deviation from the mean of X and each matching Y value’s deviation from the mean of Y. These deviations are then multiplied pair by pair, summed, and substituted into the covariance formula.
To understand how to calculate covariance, let’s go through how to compute sample covariance and population covariance, each with an example.
How to Calculate Sample Covariance
To calculate sample covariance manually:
- Find the sample mean of the X values.
- Find the sample mean of the Y values.
- Find the deviations from the sample means of X and Y and multiply each pair of deviations.
- Add the products of deviations from the sample mean.
- Apply the sample covariance formula
Want to learn how to find the sample mean? Use the sample mean calculator.
Example 1. Finding Sample Covariance
A teacher wants to examine whether time spent studying is related to final exam scores. The table below shows the number of hours five students spent studying in the week before the exam and their final exam scores.
| Student | Study Time, X | Final Exam Score, Y |
|---|---|---|
| 1 | 1 | 55 |
| 2 | 3 | 63 |
| 3 | 4 | 68 |
| 4 | 6 | 77 |
| 5 | 6 | 87 |
Find the sample covariance between study time and final exam scores.
Solution
To find the sample covariance for the dataset manually, follow these steps:
Step 1: Find the sample mean of the X values.
To find the sample mean of X, we sum all the values of x and divide by the number of observations.
Thus, x̄ = (1 + 3 + 4 + 6 + 6) / 5
= 20 / 5
= 4
Step 2: Find the sample mean of the Y values.
To find the sample mean of the Y values, we sum all the values and divide by the number of observations.
Hence, ȳ = (55 + 63 + 68 + 77 + 87) / 5
= 350 / 5
= 70
Step 3: Find the deviations from the sample means of X and Y and multiply each pair of deviations.
Next, we need to subtract the sample mean of X from each X value, subtract the sample mean of Y from each matching Y value, and multiply the paired deviations. The table below shows you how to find these deviations and multiply them.
Recall: x̄ = 4 and ȳ = 70 from steps 1 and 2 above.
| xᵢ | xᵢ − x̄ | yᵢ | yᵢ − ȳ | (xᵢ − x̄)(yᵢ − ȳ) |
|---|---|---|---|---|
| 1 | 1 − 4 = -3 | 55 | 55 − 70 = -15 | (-3)(-15) = 45 |
| 3 | 3 − 4 = -1 | 63 | 63 − 70 = -7 | (-1)(-7) = 7 |
| 4 | 4 − 4 = 0 | 68 | 68 − 70 = -2 | (0)(-2) = 0 |
| 6 | 6 − 4 = 2 | 77 | 77 − 70 = 7 | (2)(7) = 14 |
| 6 | 6 − 4 = 2 | 87 | 87 − 70 = 17 | (2)(17) = 34 |
Step 4: Add the products of deviations from the sample means.
The products of deviations is: Σ(xᵢ − x̄)(yᵢ − ȳ) = 45 + 7 + 0 + 14 + 34
= 100
Step 5: Apply the Sample covariance formula
By definition, the sample covariance formula is: sxy = Σ(xᵢ − x̄)(yᵢ − ȳ) / (n − 1)
Substituting the values, we have:
sxy = 100/(5-1)
= 25.
Therefore, the covariance between study time (X) and final exam score (Y) is 25. Because the covariance is positive, study time and final exam scores tend to move in the same direction in this dataset.
Example 1. Verification using the calculator
You can also verify the results using the covariance calculator and following these simple steps:
- Select Sample as the covariance type
- Enter the study time values into the X values input field
- Enter the final exam score values into the Y values input field
- Click calculate
The calculator will instantly return the covariance as sxy = 25 (similar to the manual method).
How to Calculate Population Covariance
To calculate population covariance manually:
- Find the population mean of the X values.
- Find the population mean of the Y values.
- Find the deviations from the population means of X and Y and multiply each pair of deviations.
- Add the products of deviations from population means.
- Apply the population covariance formula.
Want to learn how to find the population mean? Use the population mean calculator.
Example 2. Finding Population Covariance
A support manager wants to examine whether training time is related to the number of unresolved customer tickets. The table below shows all five support agents in the team, their training hours, and the number of unresolved tickets at the end of the week.
| Agent | Training Hours, X | Unresolved Tickets, Y |
|---|---|---|
| 1 | 1 | 18 |
| 2 | 2 | 14 |
| 3 | 3 | 13 |
| 4 | 4 | 9 |
| 5 | 5 | 6 |
Find the population covariance between training hours and unresolved tickets.
Solution
Since the data include all five support agents in the team, we treat the data as population data.
To find the population covariance for the dataset manually, follow these steps:
Step 1: Find the population mean of the X values.
To find the population mean of X, we sum all the X values and divide by the total number of values.
Thus, μx = (1 + 2 + 3 + 4 + 5) / 5
= 15 / 5
= 3
Step 2: Find the population mean of the Y values.
To find the population mean of Y, we sum all the Y values and divide by the total number of values.
Hence, μy = (18 + 14 + 13 + 9 + 6) / 5
= 60 / 5
= 12
Step 3: Find the deviations from population means of X and Y and multiply each pair of deviations.
Recall: From steps 1 and 2 above, μx = 3 and μy = 12.
Therefore, we need to subtract the population mean of X (μx = 3) from each X value, subtract the population mean of Y (μy = 12) from each matching Y value, and multiply the paired deviations. The table below shows you how to find these deviations and multiply them.
| xᵢ | xᵢ − μx | yᵢ | yᵢ − μy | (xᵢ − μx)(yᵢ − μy) |
|---|---|---|---|---|
| 1 | 1 − 3 = -2 | 18 | 18 − 12 = 6 | (-2)(6) = -12 |
| 2 | 2 − 3 = -1 | 14 | 14 − 12 = 2 | (-1)(2) = -2 |
| 3 | 3 − 3 = 0 | 13 | 13 − 12 = 1 | (0)(1) = 0 |
| 4 | 4 − 3 = 1 | 9 | 9 − 12 = -3 | (1)(-3) = -3 |
| 5 | 5 − 3 = 2 | 6 | 6 − 12 = -6 | (2)(-6) = -12 |
Step 4: Add the products of deviations from the population means.
The sum of the products of deviations is: Σ(xᵢ − μx)(yᵢ − μy) = -12 + (-2) + 0 + (-3) + (-12)
= -29
Step 5: Apply the population covariance formula.
By definition, the population covariance formula is: σxy = Σ(xᵢ − μx)(yᵢ − μy) / N
Substituting the values, we have:
σxy = -29 / 5
= -5.8
Therefore, the population covariance between training hours (X) and unresolved tickets (Y) is: σxy = -5.8
Because the covariance is negative, training hours and unresolved tickets tend to move in opposite directions in this dataset. In other words, agents with more training hours tend to have fewer unresolved tickets.
Example 2. Verification using the calculator
You can also verify the results using the covariance calculator by following these simple steps:
- Select Population as the covariance type.
- Enter the training hours into the X values input field.
- Enter the unresolved tickets into the Y values input field.
- Click Calculate.
The calculator will instantly return the covariance as σxy = -5.8, which matches the manual method.
Covariance vs Correlation
Although covariance and correlation are closely related, they answer slightly different questions. While covariance tells you whether two variables move together in the same direction or in opposite directions, correlation tells you the direction and standardized strength of the linear relationship.
One of the notable differences between covariance and correlation is that covariance is dependent on the units of measurement, whereas correlation does not. The biggest difference is that covariance depends on units, while correlation does not.
Want to calculate the correlation instead? Use the correlation coefficient calculator.
Frequently Asked Questions
This calculator finds the covariance between two paired variables, either from sample data or population data. It gives you instant results and shows you how to find the covariance manually using your own data.
Enter the X values in the first box and the matching Y values in the second box. You can separate values using commas, spaces, tabs, or line breaks.
Choose Sample if your data are part of a larger population. However, if your data include every paired value in the full population being studied, choose Population
Covariance uses paired data. Each X value must have one matching Y value. If the lists have different lengths, the calculator cannot form complete pairs.
No. Covariance shows the direction of joint movement, while correlation gives a standardized measure of direction and strength.
Yes. Unlike correlation, which is limited to values between -1 and 1, covariance can take any value. Its size depends on the units of the two variables.
