
How to Use the 5 Number Summary Calculator
This calculator helps you find the 5-number summary and shows you exactly how to find these values manually. To use the calculator:
- Enter your data values in the data input box. Make sure to separate values using commas, spaces, tabs, or line breaks. The calculator also accepts copy-paste values from Excel, Google Sheets, or text documents.
- Click Calculate.
The calculator will instantly return the five-number summary results and show you exactly how to find each one of them by hand. It will also create a box plot to help you see how these 5 numbers are visually positioned.
Example 1. Finding the 5 Number Summary Using the Calculator
A researcher records the number of minutes taken by 7 students to complete a short task:
31, 35, 38, 40, 42, 47, 50
Find the five-number summary.
Solution
To find the five-number summary using the calculator:
- Copy and paste the above values into the data input field
- Click Calculate
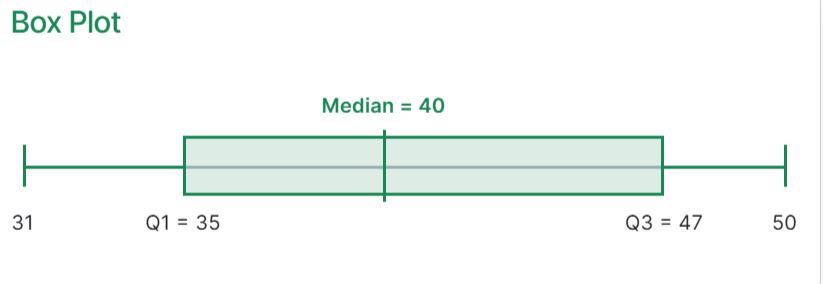
The calculator will return the 5-number summary statistics as follows:
- Minimum = 31
- Q1 = 35
- Median = 40
- Q3 = 47
- Maximum = 50
It will also present these numbers in a box plot as shown below.
Want to learn how each of the 5 numbers was computed? You can review the step-by-step solution section of the calculator.
What is a five-number summary?
A 5-number summary is a set of five descriptive statistics that provides a quick, reliable overview of the center, spread, and overall distribution of a dataset. These five summary statistics values are arranged from the smallest to the largest and include:
- Minimum
- Lower Quartile (Q1)
- Median (Q2)
- Upper Quartile (Q3)
- Maximum
Each of these 5 numbers is discussed below:
1. Minimum
The minimum is the smallest value in the dataset. After arranging the dataset in ascending order, the minimum is the very first value.
2. Lower Quartile (Q1)
The lower quartile (Q1), also known as the first quartile, is the middle value of the lower half of the data when arranged from smallest to largest. It is also called the 25th percentile because it divides the bottom 25% of your data from the top 75%.
3. Median (Q2)
The median (Q2), also called the second quartile, is the middle value of the dataset when arranged from the smallest to the largest. It is also called the 50th percentile because exactly 50% of your data falls below this value, and 50% falls above it.
4. Upper Quartile (Q3)
The Upper quartile (Q3), also known as the third quartile, is the middle value of the upper half of the data when arranged from the smallest to the largest. It is also called the 75th percentile because it marks the boundary where 75% of the data points fall at or below it, while the remaining 25% fall above it.
5. Maximum
The maximum is the largest value in the dataset. This is the last value after arranging the dataset in ascending order.
How to find the 5-number summary
To find the five-number summary manually, follow these steps:
- Arrange the data in ascending order.
- Identify the minimum and maximum values.
- Find the median.
- Find the median of the lower half of the data to get Q1
- Find the median of the upper half of the data to get Q2
- State the five-number summary.
Example 2. Finding the 5 Number Summary Manually
A teacher records the following scores from a short assessment:
18, 12, 24, 10, 22, 14, 8, 20
Find the five-number summary.
Solution
To find the 5-number summary for the above dataset, follow these steps:
Step 1: Arrange the data in ascending order.
Arranging the data in ascending order gives:
8, 10, 12, 14, 18, 20, 22, 24
Step 2: Identify the minimum and maximum values.
From the ordered dataset:
- Minimum = 8
- Maximum = 24
Step 3: Find the median.
There are 8 values in the dataset. Since 8 is even, the median is the average of the two middle values.
The two middle values are 14 and 18. Therefore, Median = (14 + 18) / 2
= 16
Hence, Median = 16.
Want to learn more about the median? Use the median calculator to find the median and learn how to find it manually.
Step 4: Find the first quartile, Q1.
Q1 is the median of the lower half of the ordered dataset.
The lower half of the ordered data is: 8, 10, 12, 14. Hence, Q1 = (10+12)/2
= 11
Therefore, Q1 = 11.
Step 5: Find the third quartile, Q3.
Q3 is the median of the upper half of the ordered dataset.
The upper half of the dataset is: 18, 20, 22, 24. The median of this upper half is (20+22)/2
= 21
Therefore, Q3 = 21.
Step 6: State the five-number summary.
Since we already have all five numbers, we can list the 5-number summary as follows:
- Minimum = 8
- Q1 = 11
- Median = 16
- Q3 = 21
- Maximum = 24
Therefore, the 5-number summary for the dataset is: 8, 11, 16, 21, 24
Five Number Summary and Box Plot
A box plot is a visual display of the five-number summary. Thus, if you’re required to visualize the five numbers, a box plot is always the most appropriate choice.
In a box plot:
- The left whisker starts at the minimum.
- The left edge of the box shows Q1.
- The line inside the box shows the median.
- The right edge of the box shows Q3.
- The right whisker ends at the maximum.
This makes it easier to see how the data are spread out. The box shows the middle 50% of the data, while the whiskers show how far the smallest and largest values are from the quartiles.
A box plot is especially useful when comparing two or more datasets because you can quickly compare their centers, spreads, and possible skewness.
