
How to Use the Grouped Mean Calculator
This calculator helps you find the mean of grouped data (class intervals with frequency data or frequency table data). To use the calculator:
- Select the type of data. Choose the Class intervals option if your data is grouped into intervals such as 10–19, 20–29, 30–39, etc. However, if your data has exact values and their frequencies, choose the Frequency table option.
- Enter the values in the data input fields. You can add or remove rows depending on the size of your dataset.
- Click Calculate
The calculator will instantly return the mean of the grouped data and show you exactly how the value was computed using your own data. This makes it useful when you want to check your homework, verify a manual calculation, or understand how to calculate the mean of grouped data manually.
What Is the Mean of Grouped Data?
The mean of grouped data is the average value of data that has been summarized into a frequency table or class intervals. In simple raw data such as 12, 16, 18, 21, you find the average by summing all the values and dividing by the total number of values. However, the method for computing the average for grouped data varies because you don’t have every individual value but rather a summary showing the number of values per category. In this case, we estimate the mean by using the midpoint of each class interval.
Mean of Grouped Data Formula
The formula for finding the mean of grouped data varies depending on the type of grouped data you’re working with. If your data is in the form of a frequency table, where exact values are paired with their frequencies, the grouped mean formula is:
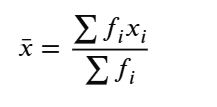
Where:
- xi is each data value
- fi is the frequency of the ith class
- fx is the product of the value and its frequency
- Σfx is the sum of all fx values
- Σf is the total frequency
However, if your data is grouped into class intervals, the formula is:
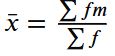
Where:
- f is the frequency of each class
- m is the midpoint of each class interval
- fm is the product of the frequency and midpoint
- Σfm is the sum of all fm values
- Σf is the total frequency
In this case, the midpoint formula is: m = (Lower limit+Upper limit)/2
How to Find the Mean of Grouped Data (Frequency Table)
To calculate the mean from a frequency table manually, follow these steps:
- Multiply each value, x, by its frequency, f, to get fx.
- Add all fx values to get Σfx.
- Add all frequencies to get Σf.
- Divide Σfx by Σf to get the arithmetic mean, x̄.
Example 1
The table below shows the number of books read by students in one month.
| Number of books, x | Frequency, f |
|---|---|
| 1 | 4 |
| 2 | 7 |
| 3 | 6 |
| 4 | 3 |
Find the mean number of books read.
Solution
To find the mean number of books read manually, follow these steps:
Step 1: Multiply each value by its frequency to get fx
| x | f | fx |
|---|---|---|
| 1 | 4 | 4 |
| 2 | 7 | 14 |
| 3 | 6 | 18 |
| 4 | 3 | 12 |
Step 2: Add the fx values to get Σfx.
Therefore, Σfx = 4 + 14 + 18 + 12
= 48
Step 3: Add the frequencies to get Σf
Thus, Σf = 4 + 7 + 6 + 3
= 20
Step 4: Apply the arithmetic mean formula for the frequency table.
By definition, the formula is: x̄ = Σfx / Σf
Substituting the values into the formula and solving gives:
x̄ = 48 / 20
= 2.4
Therefore, the mean is x̄ = 2.4. This means the students read an average of 2.4 books during the month.
How to Find Mean of Grouped Data (Class Intervals)
To calculate the mean for a dataset with class intervals manually:
- Find the midpoint of each class interval.
- Multiply each midpoint, m, by its frequency, f, to get fm.
- Add all fm values to get Σfm.
- Add all frequencies to get Σf.
- Divide Σfm by Σf to get the estimated arithmetic mean, x̄.
Example 2
The table below shows the marks obtained by students in a test.
| Marks | Frequency, f |
|---|---|
| 0–20 | 3 |
| 20–40 | 6 |
| 40–60 | 8 |
| 60–80 | 5 |
| 80–100 | 2 |
Find the estimated mean mark.
Solution
Since the data are grouped into class intervals, we can manually find the estimated mean mark as follows:
Step 1: Find the midpoint
By definition, midpoint, m = (lower limit + Upper Limit)/2
For instance, the midpoint for the class 0 – 20 is (0+20)/2
=20/2
=10.
You can follow the same procedure and fill in the midpoint column. Once you’ve the midpoint, m, multiply it by f to get fm
| Marks | Midpoint, m | Frequency, f |
|---|---|---|
| 0–20 | 10 | 3 |
| 20–40 | 30 | 6 |
| 40–60 | 50 | 8 |
| 60–80 | 70 | 5 |
| 80–100 | 90 | 2 |
Step 2. Multiply the midpoint, m, by the frequency, f, to get fm
The table becomes:
| Marks | Midpoint, m | Frequency, f | fm |
|---|---|---|---|
| 0–20 | 10 | 3 | 30 |
| 20–40 | 30 | 6 | 180 |
| 40–60 | 50 | 8 | 400 |
| 60–80 | 70 | 5 | 350 |
| 80–100 | 90 | 2 | 180 |
Step 3: Add the fm values to get Σfm
Therefore, Σfm = 30 + 180 + 400 + 350 + 180
= 1140
Step 4: Add the frequencies to get Σf
Thus, Σf = 3 + 6 + 8 + 5 + 2
= 24
Step 5: Apply the formula.
By definition, the estimated mean formula for grouped data with class intervals is: x̄ = Σfm / Σf
Substituting the values and solving gives: x̄ = 1140 / 24
= 47.5
Therefore, the estimated mean is x̄ = 47.5. This means that the estimated average mark is 47.5.
Frequently Asked Questions
A grouped mean calculator is a tool that finds the mean of data arranged in groups, class intervals, or frequency tables. It uses frequencies and either exact values or class midpoints to calculate the mean.
If the data uses exact values and frequencies, the grouped mean is exact. However, if the data uses class intervals, the grouped mean is usually an estimate because the original raw values are not known.
Use Σfx when your table gives exact values and frequencies. However, if your table has class intervals and frequencies, use Σfm, where m is the midpoint of each class.
