
Want to calculate the skewness instead? Use the skewness calculator.
How to Use the Kurtosis Calculator
This calculator quickly finds the kurtosis for sample or population data. To use the calculator:
- Select whether you’re working with sample data or population data
- Enter the values in the data input field. You can separate them using commas, spaces, tabs, or line breaks. Alternatively, you can copy and paste values from Excel, Google Sheets, or even text documents
- Click calculate
The calculator will instantly return the kurtosis and tell you whether the distribution is leptokurtic, platykurtic, or approximately mesokurtic. It will also display a smooth curve for your data with a normal reference curve to help see the visual distribution of your data.
Note. This calculator reports kurtosis using the excess kurtosis convention, which is widely used in many statistics tools, including Excel’s KURT() function. Unlike Pearson’s kurtosis, where a normal distribution has kurtosis 3, excess kurtosis has the following characteristics:
- a normal distribution has kurtosis 0
- positive kurtosis means heavier tails than a normal distribution
- negative kurtosis means lighter tails than a normal distribution
Therefore, with this kurtosis calculator, you do not need to add or subtract 3. The value returned by the tool is already the kurtosis value using the common excess kurtosis convention.
What Is Kurtosis?
Kurtosis is a descriptive statistic that helps describe the tail behavior of a distribution. It tells you whether your data has more or fewer extreme values compared with a normal distribution.
A distribution with a high positive kurtosis (greater than 3, or an excess kurtosis > 0) is more likely to have more extreme values and hence heavier tails. On the other hand, a distribution with negative kurtosis has thinner, lighter tails than a standard normal distribution.
Therefore, kurtosis is often described using words like “peaked” or “flat,” but the most useful way to think about kurtosis is through the tails of the distribution. Therefore, after computing the kurtosis for any dataset, you should ask yourself. Does this data have normal-like tails, heavier tails, or lighter tails?
Kurtosis Formula
A common population excess kurtosis formula is:
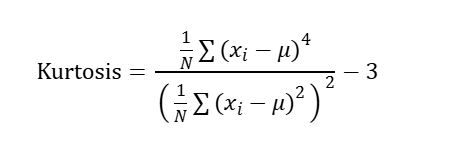
Where:
- xi represents each value
- μ is the population mean
- N is the number of values in the population
- (-3) adjusts the result so that a normal distribution has kurtosis 0
However, for sample data, this calculator uses the adjusted sample excess kurtosis formula, similar to Excel’s KURT() function. This adjustment helps estimate population kurtosis from sample data. The formula is:

Where:
- G2 is the adjusted sample kurtosis. This is the kurtosis value reported by the calculator for sample data.
- n is the number of values in the sample.
- xi is the ith data value in the sample.
- x̄ is the sample mean.
- s is the sample standard deviation.
- means add the expression for all values from the first value to the nth value.
- is the fourth power of the standardized deviation of each value from the mean.
- is the adjustment term that makes the result an excess kurtosis value, where a normal distribution has kurtosis 0.
Types of Kurtosis
There are three main types of kurtosis, which include leptokurtic, platykurtic, and mesokurtic. Each of them is discussed below.
1. Leptokurtic
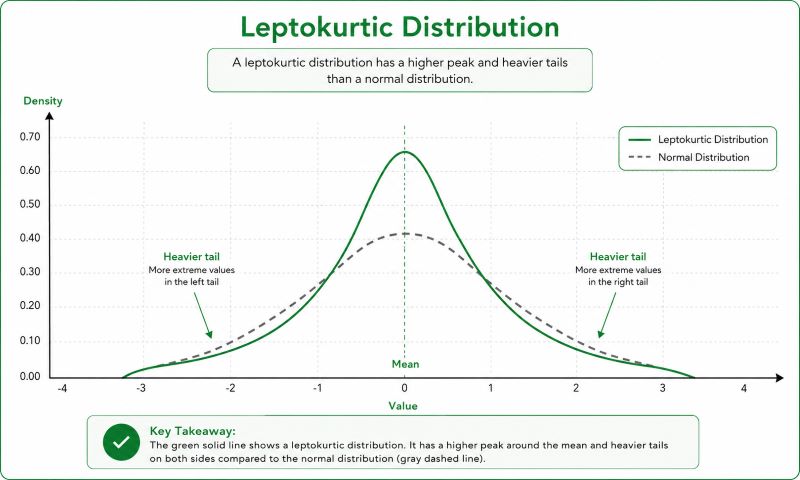
Leptokurtic kurtosis describes a statistical distribution with a tall, sharp peak and heavy, “fat” tails. In a dataset with a leptokurtic distribution, data values are heavily clustered around the mean (resulting in a narrow center) but are also more prone to extreme outliers.
Therefore, a distribution can be said to be leptokurtic if it has the following characteristics:
- Has a Pearson kurtosis > 3 or excess kurtosis > 0
- Has positive excess kurtosis
- Slender, Tall Peak
- Fat tails
Platykurtic Distribution
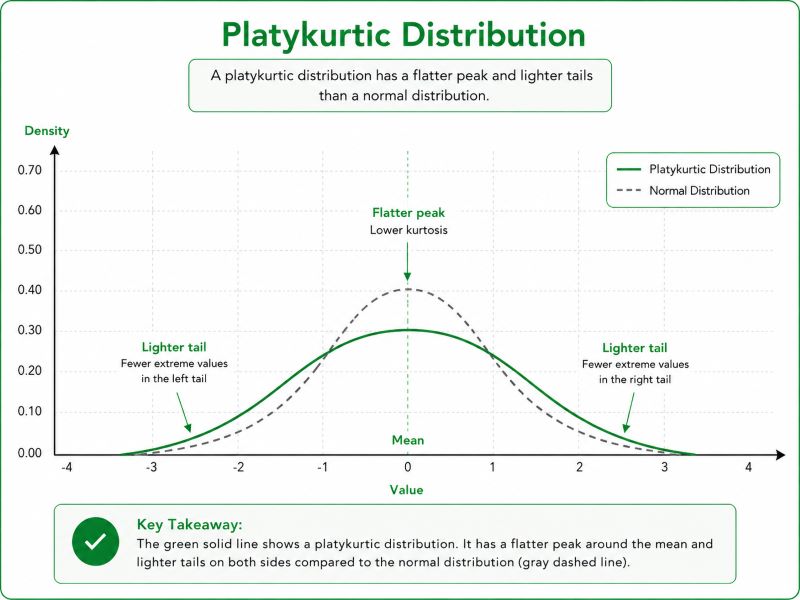
A platykurtic distribution is a statistical data set with a flatter peak and thinner, lighter tails than a normal distribution. It has the following characteristics:
- Negative excess kurtosis (Pearson kurtosis < 3)
- Less likely to have extreme observations compared to a normal distribution
- Lighter tails than a normal distribution
- Data is more evenly spread and consistent across the range.
Mesokurtic Distribution
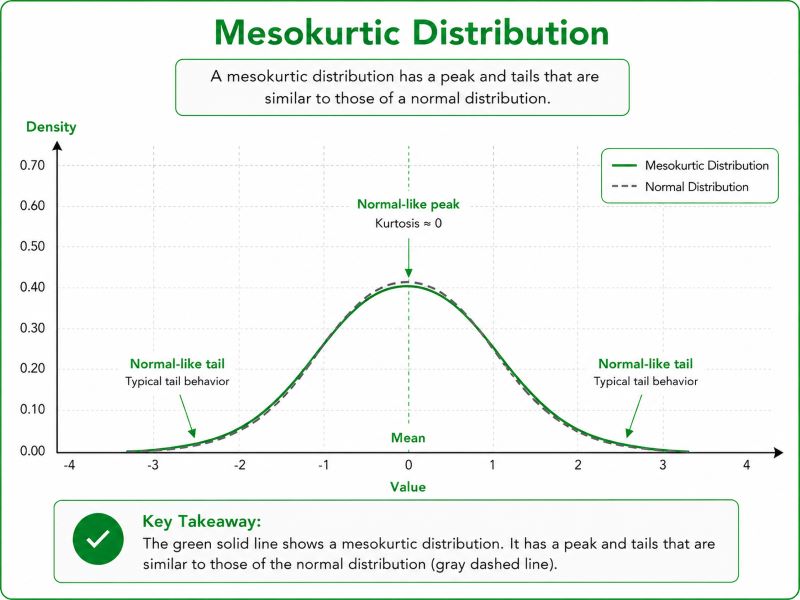
A mesokurtic distribution is a statistical dataset with a kurtosis of exactly 3.0. This means that it has the exact same outlier behavior and tail weight as a standard normal distribution (bell curve). Therefore, it serves as the baseline for comparing data extremity, with an excess kurtosis of zero.
The key characteristics of a mesokurtic distribution include:
- The raw kurtosis = 3.
- Excess kurtosis of 0
- Standard to moderate outliers if present
- Neither unusually heavy-tailed (leptokurtic) nor light-tailed (platykurtic)
The normal distribution is the standard example of a mesokurtic distribution.
Tip. A kurtosis value near 0 does not automatically mean your data is perfectly normal. It only means that, based on kurtosis alone, the tails are not much heavier or lighter than the tails of a normal distribution.
Kurtosis vs Skewness
Although kurtosis and skewness are often reported together when describing the shape of a distribution, they measure different aspects of the data. While kurtosis focuses on tail behavior by indicating whether extreme values are more or less common compared to the normal distribution, skewness focuses on symmetry by telling you whether the distribution leans to the left, right, or is approximately symmetric.
Want to check the asymmetry of your data? Use the skewness calculator.
Kurtosis and Normal Distribution
Kurtosis is often interpreted by comparing a dataset to the normal distribution. Under the excess kurtosis convention used by this calculator, a normal distribution has kurtosis 0.
Therefore,
- kurtosis close to 0 suggests normal-like tail behavior
- kurtosis above 0 suggests heavier tails
- kurtosis below 0 suggests lighter tails
However, kurtosis alone is not enough to decide whether data is normally distributed because a dataset may have kurtosis close to 0 but still be skewed. Another dataset may have noticeable kurtosis but still look fairly normal in a small sample.
Want to learn more about the normal distribution? Use the normal distribution calculator.
Frequently Asked Questions
A kurtosis calculator is a tool that measures the tail behavior of a dataset. It helps show whether the data has heavier tails, lighter tails, or normal-like tails compared with a normal distribution.
Kurtosis describes how extreme the tails of a distribution are compared with a normal distribution. Positive kurtosis suggests heavier tails, while negative kurtosis suggests lighter tails.
Positive kurtosis means the distribution is leptokurtic. In this case, the distribution has heavier tails than a normal distribution, and extreme values may occur more often.
Negative kurtosis means the distribution is platykurtic. Notably, the distribution has lighter tails than a normal distribution, and extreme values may occur less often.
Using the excess kurtosis convention, kurtosis 0 means the distribution has tail behavior similar to a normal distribution.
Many calculators and software tools report excess kurtosis and simply call it kurtosis. This calculator follows that convention. Under this approach, a normal distribution has kurtosis 0.
