How to Use the Normal Distribution Calculator
This normal distribution calculator allows you to find probabilities for raw values that follow a normal distribution. To find normal probabilities for raw scores using this tool, follow these steps:
- Enter the mean (μ).
- Enter the standard deviation (σ).
- Select the probability type (P(X < x), P(X > x), P(a < X < b), or P(Outside a and b)).
- Enter the raw value or values required.
- Click Calculate.
The calculator will instantly show your selected probability and display a graph showing the area under the normal distribution curve. It also provides a clear, step-by-step solution, showing how the probability was computed, from standardizing raw scores to getting the correct probability.
This calculator is especially helpful when a question gives you a real value, such as an exam score, height, weight, measurement, waiting time, or product weight. Instead of manually converting the value into a z-score first, you just enter the raw value directly and let the calculator show the full step-by-step solution.
Tip. You can also use this calculator for the standard normal distribution. Since the standard normal distribution has a mean of 0 and a standard deviation of 1, simply enter 0 as the mean, 1 as the standard deviation, and enter your z-score as the x value (s).
Example 1. Probability Less Than a Value
Suppose exam scores are normally distributed with a mean of 70 and a standard deviation of 10. What is the probability that a randomly selected student scored less than 85?
Solution
Here, we need to find P(X<85). To find this probability using the calculator:
- Select the correct probability type as P(X<x)
- Enter mean, μ = 70
- Enter standard deviation, σ = 10
- Enter raw score, x = 85
- Click Calculate
The calculator will instantly return the correct probability, P(X < 85) = 0.9332, and show you exactly how the probability was computed. This means that the probability that a randomly selected student scored less than 85 is 0.9332, or 93.32%.
Example 2. Probability Greater Than a Value
Suppose product weights are normally distributed with a mean of 50 grams and a standard deviation of 4 grams. What is the probability that a randomly selected product weighs more than 56 grams?
Solution
Here, we need to find P(X > 56). To find this probability using the calculator:
- Select the correct probability type as P(X > x)
- Enter mean, μ = 50
- Enter standard deviation, σ = 4
- Enter raw score, x = 56
- Click Calculate
The calculator will instantly return the correct probability, P(X > 56) = 0.0668, and show you exactly how the probability was computed. This means that the probability that a randomly selected product weighs more than 56 grams is 0.0668, or 6.68%.
Example 3. Probability Between Two Values
Suppose IQ scores are normally distributed with a mean of 100 and a standard deviation of 15. What is the probability that a randomly selected person has an IQ between 85 and 115?
Solution
Here, we need to find P(85 < X < 115). To find this probability using the calculator:
- Select the correct probability type as P(a < X < b)
- Enter mean, μ = 100
- Enter standard deviation, σ = 15
- Enter lower value, a = 85
- Enter upper value, b = 115
- Click Calculate
The calculator will instantly return the correct probability, P(85 < X < 115) = 0.6827, and show you exactly how the probability was computed. This means that the probability that a randomly selected person has an IQ between 85 and 115 is 0.6827, or 68.27%.
Example 4. Probability Outside Two Values
Suppose scores are normally distributed with a mean of 100 and a standard deviation of 15. What is the probability that a score is below 70 or above 130?
Solution
Here, we need to find P(X < 70 or X > 130). To find this probability using the calculator:
- Select the correct probability type as Outside a and b
- Enter mean, μ = 100
- Enter standard deviation, σ = 15
- Enter lower value, a = 70
- Enter upper value, b = 130
- Click Calculate
The calculator will instantly return the correct probability, P(X < 70 or X > 130) = 0.0455, and show you exactly how the probability was computed. This means that the probability that a score is below 70 or above 130 is 0.0455, or 4.55%.
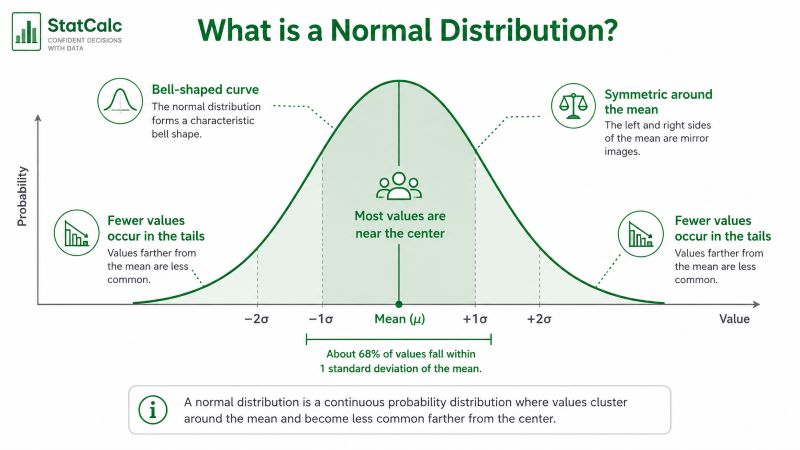
What Is a Normal Distribution?
A normal distribution is a bell-shaped distribution where most values are close to the mean, and fewer values appear as you move farther away from the mean.
The curve is symmetric, which means the left and right sides are mirror images. The mean is located at the center of the curve.
A normal distribution is described using two main values:
- Mean (μ): the center of the distribution
- Standard deviation (σ): how spread out the values are
A smaller standard deviation creates a narrower curve because the values stay closer to the mean. In contrast, a larger standard deviation creates a wider curve because the values are more spread out.
Normal distributions are commonly used for test scores, heights, weights, measurement errors, product weights, and many other continuous variables. The figure below shows a normal distribution curve.
Normal Distribution Formula
The normal distribution probability density function is:
Where:
- x is the raw value
- μ is the mean
- σ is the standard deviation
- e is Euler’s number
- π is pi
For most practical questions, you do not need to calculate this formula by hand. The more important step is usually converting the raw value into a z-score.
The calculator uses this z-score formula:
This tells you how many standard deviations a value is from the mean. After the raw value is converted into a z-score, the calculator finds the area under the normal curve.
Raw Scores and Z-Scores
A raw score is the original value from your problem. For example, if an exam has a mean of 70 and a student scores 85, the raw score is 85. On the other hand, a z-score tells you how far that raw score is from the mean in standard deviation units.
For example, suppose scores on a statistics exam are normally distributed with a mean of 70 and a standard deviation of 10. If a student scored 85, then we can calculate the z-score as follows:
z = (85-70)/10
= 1.5
This means the student’s score of 85 is 1.50 standard deviations above the mean.
Alternatively, you can quickly standardize the raw scores to z using the z-score calculator and then look up the probabilities from the standard normal table. However, with our normal distribution calculator, you don’t have to convert them because it accepts raw values, standardizes them behind the scenes, and computes the correct probability.
Can This Calculator Be Used for the Standard Normal Distribution?
Yes. The standard normal distribution is a normal distribution with a mean of 0 and a standard deviation of 1. This means you can use this calculator for standard normal probabilities by entering:
- Mean = 0
- Standard deviation = 1
- Your z-score as the x value
For example, to find P(Z<1.96) using the calculator, follow these steps:
- Enter mean = 0
- Enter standard deviation = 1
- x = 1.96
- Select the correct probability type as P(X < x)
- Click Calculate
The calculator will return the area to the left of 1.96 under the standard normal curve as 0.9750. This works because when μ = 0 and σ = 1, the raw value and the z-score are the same.
However, if your question already gives z-scores and you only want standard normal probabilities, the z-score probability calculator may be faster because it is designed specifically for z-score probability problems.
When Should You Use This Calculator?
Use this calculator when your problem gives a normal distribution with a mean and standard deviation, and you need to find a probability.
This includes questions such as:
- What percentage of values are below a certain score?
- What is the probability that a value is greater than a cutoff?
- What proportion of observations fall between two values?
- What percentage of values fall outside a given range?
- How likely is a raw score under a normal model?
You can also use it for standard normal distribution questions by entering mean = 0 and standard deviation = 1. However, if your problem works in the opposite direction, where you already know the probability and need to find the matching z value, use the inverse normal distribution calculator.
Frequently Asked Questions
A normal distribution calculator finds probabilities for values that follow a normal distribution. It uses the mean, standard deviation, and raw value or range to calculate the area under the normal curve.
Yes. To use it for z-scores, enter mean = 0 and standard deviation = 1. Then enter the z-score as the x value. This works because the standard normal distribution has a mean of 0 and a standard deviation of 1.
A normal distribution can have any mean and any positive standard deviation. However, the standard normal distribution is a special normal distribution with a mean of 0 and a standard deviation of 1.
Probability between two values means the area under the normal curve between a lower value and an upper value. For example, P(85 < X < 115) gives the probability that X falls between 85 and 115.