
Want to find the sample variance or population variance instead? Use the variance calculator.
How to Use the Standard Deviation Calculator
This standard deviation calculator helps you find the sample standard deviation or population standard deviation of a dataset. It also shows you how to find each of the standard deviations manually, using your own dataset.
To use the calculator:
- Choose the type of data (sample or population). If the data values are a sample drawn from a larger population, use the Sample option. However, if your data values represent the entire group you want to study, select the Population option.
- Enter your data values. You can type or paste your numbers into the data input field. This calculator accepts data values separated using commas, spaces, tabs, or line breaks. You can also paste values directly from Excel or Google Sheets.
- Click Calculate.
The calculator will instantly return the standard deviation depending on the type of data you’re working with and show you how the answer was computed, step-by-step.
Want to quickly compute either the sample mean or the population mean required in the standard deviation formula? Use the mean calculator to get instant results, with a clear, step-by-step solution.
Example 1. Find the Sample Standard Deviation Using the Calculator
Suppose a researcher records the following sample data: 6, 8, 9, 11, 13, 15. Find the sample standard deviation.
Solution
To find the sample standard deviation using the calculator:
- Select the Sample option.
- Copy and paste the dataset into the data input field
- Click Calculate.
The calculator will give you the correct answer as: Sample Standard Deviation, s = 3.32666. It will also show you how the answer was computed for this dataset, step-by-step.
Example 2: Find the Population Standard Deviation Using the Calculator
Suppose a small business records the number of orders received over five complete working days:
18, 22, 20, 25, 15
Find the population standard deviation for this dataset.
Solution
Since the data includes all working days in the week being studied, we can treat it as population data.
To find the population standard deviation using the calculator:
- Select the Population option.
- Copy and paste the values into the data input field
- Click Calculate.
The calculator will instantly give you the answer as: Population Standard Deviation, σ = 3.405877. It will also show the population standard deviation was computed for your data, step-by-step.
What is Standard Deviation?
Standard deviation is a statistical measure of dispersion that quantifies the amount of variability in a dataset. It basically shows how far individual data points deviate from the mean.
Therefore, a small standard deviation means that most values in your dataset lie close to the mean, suggesting low variability. Similarly, a large standard deviation indicates that there’s greater variability within the data.
The two common types of standard deviation are:
- Population standard deviation (σ). It measures how spread out all data points in an entire group (population) are from the average (mean).
- Sample standard deviation (s). It measures how spread out the data points in a sample are from the sample mean.
Population Standard Deviation
The population standard deviation is a measure of dispersion, which tells us how much the entire population varies from the population mean. In statistics, the population standard deviation symbol is a Greek letter sigma (σ).
Since every member of the population is studied, we need to divide the deviations from the population mean by N. In this case, N is the total number of observations in the population.
In simple terms, the population standard deviation tells you the typical distance between the population values and the population mean.
Population Standard Deviation Formula
The population standard deviation formula is:
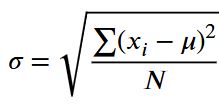
Where:
- σ is the population standard deviation.
- μ is the population mean.
- xi is each individual data value.
- N is the total number of values in the population.
- Σ is the summation symbol.
While the formula may seem complex, its application is simple. You calculate how far each value is from the population mean, square each deviation, find the average of the squared deviations, and then take the square root.
Alternative Population Standard Deviation Formula
The population standard deviation can also be calculated using an alternative formula, sometimes called the shortcut formula or computational formula. This formula is common in statistics homework because it allows you to quickly find the population standard deviation from summary statistics such as Σxi², N, and μ.
The alternative population standard deviation formula is:
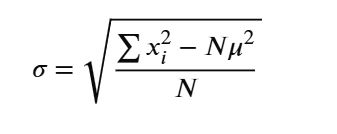
Where:
- σ is the population standard deviation.
- xi is each individual data value.
- Σxi² is the sum of the squared values.
- μ is the population mean.
- N is the total number of values in the population.
This alternative formula gives the same answer as the main population standard deviation formula. While the main formula is often easier to understand because it clearly shows that standard deviation is based on distance from the mean, the alternative formula can be faster when you already have Σxi and Σxi².
Let’s learn how to find the population standard deviation with an example.
How to Find Population Standard Deviation by Hand
To find the population standard deviation manually, you can either use the main population standard deviation formula or the alternative shortcut formula. In this section, we demonstrate that both methods arrive at the same answer using the following example.
Example. Find the population standard deviation for the following dataset: 4, 6, 8, 10, 12.
Method 1. Using the Main Population Standard Deviation Formula
To compute the population standard deviation manually using the main Population standard deviation formula, follow the steps:
Step 1: Calculate the Population Mean (μ)
You find the population means (μ) by adding all data values and dividing the results by the total number of observations (N).
Therefore, the population mean is:
Alternatively, you quickly find the population mean using the mean calculator.
Step 2: Find Each Deviation from the Mean
This step involves subtracting the mean from each deviation to get the deviations from the mean (xi−μ). You can use a table for simplicity, as shown below:
| Observation (xi) | Deviation from the mean (xi−μ) |
| 4 | 4-8 = -4 |
| 6 | 6-8 = -2 |
| 8 | 8-8 = 0 |
| 10 | 10-8 = 2 |
| 12 | 12-8 = 4 |
Step 3: Square Each Deviation
Here, you need to square each of the deviations to remove the negative values. You’ll find (xi−μ)^2. Thus, we extend the table as follows:
| Observation (xi) | Deviation from the mean (xi−μ) | Square the deviations (xi−μ)^2 |
| 4 | 4-8 = -4 | (-4)^2 = 16 |
| 6 | 6-8 = -2 | (-2)^2 = 4 |
| 8 | 8-8 = 0 | (0)^2 = 0 |
| 10 | 10-8 = 2 | (2)^2 = 4 |
| 12 | 12-8 = 4 | (4) ^2 = 16 |
Step 4: Compute the Average of the Squared Deviations
Since we already have the squared deviations, we need to find the average of these deviations. Thus, we add all the squared deviations and divide by the total number of observations in the population (N) as shown below:
Step 5: Take the Square Root
The square root of the average squared deviations will give you the population standard deviation. Thus, taking the square root gives:
Therefore, the population standard deviation (σ) for the data set 4, 6, 8, 10, 12 is approximately 2.83.
Method 2: Using the Alternative Population Standard Deviation Formula
By definition, the alternative population standard deviation formula is:
From the formula, we need to find the sum of squared values, Σxi², the population size, N, and the population mean, μ. Therefore, to find the population mean of the dataset: 4, 6, 8, 10, 12, we follow these steps:
Step 1: Find the sum of squared values, Σxi².
From the dataset in the example, Σxi² = 42 + 62 + 82 + 102 + 122
= 16 + 36 + 64 + 100 + 144
= 360
Step 2. Find the population mean
By definition, the population mean formula is: μ = Σxi/N
In this case, N = 5
Substituting the population data values into the formula and solving, we get:
= (4 + 6 + 8 + 10 + 12)/5
=40/5
=8
Step 3. Substitute the values into the alternative population standard deviation formula and solve
By definition, the formula is: σ = √[(Σxi² − Nμ²) / N]
Substituting the values into the formula and solving, we get:
σ = √[(360 − 5(8)²) / 5]
=√[(360 − 5(64) / 5]
= √40/5
=2.83
Notice. Both methods yields the same population standard deviation value. Therefore, it is up to you to choose the method that seems easier for you.
NOTE: You should only use the population standard deviation when:
- The dataset includes all members of the population
- No inference about a larger group is required
- The data represent complete records, such as all employees in a company or all test scores in a class
Sample Standard Deviation
The sample standard deviation is a measure of dispersion that describes how much the values in a sample vary from the sample mean. It is used when the data represent only a subset of a larger population. In statistics, the sample standard deviation symbol is s.
Unlike the population standard deviation, which includes all members in the target population, the sample standard deviation only includes a subset of this population. To correct for potential bias, we need to divide the squared deviations by n-1, where n is the total number of observations in the sample data. This adjustment is known as Bessel’s correction.
In simple terms, the sample standard deviation tells you the typical distance between the sample values and the sample mean.
Sample Standard Deviation Formula
Therefore, the sample standard deviation formula becomes:
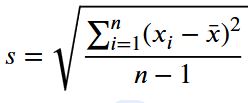
Where:
- s = sample standard deviation
- x̄ = sample mean
- xᵢ = each individual data value
- n = total number of observations in the sample
- Σ = summation symbol
Although the formula may appear complex, its application follows the same logical steps as the population standard deviation. The only difference is the use of n − 1 in the denominator.
Alternative Sample Standard Deviation Formula
The sample standard deviation can also be calculated using an alternative formula, sometimes called the shortcut formula or computational formula. This formula is common in statistics homework because it allows you to find the sample standard deviation from summary statistics such as Σxi², n, and x̄.
The alternative sample standard deviation formula is:
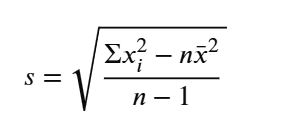
Where:
- s is the sample standard deviation.
- xi is each individual data value.
- Σxi² is the sum of the squared values.
- x̄ is the sample mean.
- n is the total number of values in the sample.
This alternative formula gives the same answer as the main sample standard deviation formula. While the main formula is often easier to understand because it clearly shows that standard deviation is based on distance from the mean, the alternative formula can be faster when you already have Σxi² and x̄.
Let’s learn how to find the sample standard deviation with an example.
How to Find the Sample Standard Deviation by Hand
To find the sample standard deviation manually, you can either use the main sample standard deviation formula or the alternative shortcut formula. In this section, we demonstrate that both methods arrive at the same answer using the following example.
Example. Find the sample standard deviation for the following dataset: 4, 6, 8, 10, 12
Since these values are treated as a sample drawn from a larger population, we use the sample standard deviation formula.
Method 1. Using the Main Sample Standard Deviation Formula
To compute the sample standard deviation manually using the main sample standard deviation formula, follow these steps.
Step 1: Calculate the Sample Mean (x̄)
To find the sample mean of the dataset, you need to add all data values and divide the results by the total number of observations in the sample (n). Thus, the sample mean is:
Step 2: Find Each Deviation from the Sample Mean
Subtract the sample mean from each data value to obtain the deviations (xi−x̄).
| Observation (xᵢ) | Deviation from the mean (xᵢ − x̄) |
|---|---|
| 4 | 4 − 8 = −4 |
| 6 | 6 − 8 = −2 |
| 8 | 8 − 8 = 0 |
| 10 | 10 − 8 = 2 |
| 12 | 12 − 8 = 4 |
Step 3: Square Each Deviation from the Sample Mean
Square each deviation to eliminate negative values. Thus, we extend the table as follows:
| Observation (xᵢ) | (xᵢ − x̄) | (xᵢ − x̄)² |
|---|---|---|
| 4 | −4 | 16 |
| 6 | −2 | 4 |
| 8 | 0 | 0 |
| 10 | 2 | 4 |
| 12 | 4 | 16 |
Step 4: Compute the Average of the Squared Deviations from the Sample Mean
Add all squared deviations and divide by n − 1 (since this is sample data). Thus, the average of the squared deviations becomes:
Step 5: Take the Square Root of the Results
The square root of the average squared deviation gives the sample standard deviation. Thus, the sample standard deviation is:
Therefore, the sample standard deviation (s) for the dataset 4, 6, 8, 10, 12 is approximately 3.16.
Method 2. Using the Alternative Sample Standard Deviation Formula
By definition, the alternative sample standard deviation formula is:
From the formula, we need to find the sum of squared values, Σxi², the sample size, n, and the sample mean, x̄.
Step 1: Find the Sum of Squared Values, Σxi²
From the dataset: 4, 6, 8, 10, 12
Σxi² = 4² + 6² + 8² + 10² + 12²
= 16 + 36 + 64 + 100 + 144
= 360
Therefore: Σxi² = 360
Step 2: Find the Sample Mean
By definition, the sample mean formula is:
x̄ = Σxi / n
From the dataset: Σxi = 4 + 6 + 8 + 10 + 12
= 40
the sample size, n = 5
Substituting the values into the formula gives:
x̄ = 40 / 5
= 8
Therefore, the sample mean, x̄ = 8
Step 3: Substitute the Values into the Alternative Formula
By definition, the alternative sample standard deviation formula is:
s = √[(Σxi² − nx̄²) / (n − 1)]
Substituting the values into the formula gives:
s = √[(360 − 5(8)²) / (5 − 1)]
= √[(360 − 5(64)) / 4]
= √[(360 − 320) / 4]
Thus, s = √(40 / 4)
= √10
= 3.16
Therefore, the sample standard deviation, s = 3.16
Observe. As you can see, both methods yield the same sample standard deviation value, s = 3.16. Therefore, both formulas are correct, and it is up to you to choose the method that feels easier for your calculation.
NOTE: You should use the sample standard deviation when:
- The data represent a subset of a larger population
- You intend to make inferences about the population
- The population standard deviation is unknown
