
How to Use the Z Score to Percentile Calculator
This z-score to percentile calculator allows you to quickly find the percentile that corresponds to any positive or negative z score.
To use the calculator:
- Enter the z score.
- Click Calculate.
The calculator will instantly return the corresponding percentile and display a standard normal curve with the area below the z score shaded. It also shows you how to convert the z-score to a percentile step by step.
Want to convert a percentile to a z-score instead? Use the percentile to z calculator.
What Does the Percentile of a Z Score Mean?
The percentile of a z-score shows the percentage of values in a normal distribution that fall at or below that z-score. A z-score of equals the 50th percentile, a positive z-score means a percentile above 50%, and a negative z-score means a percentile below 50%.
How to Convert a Z Score to a Percentile
A percentile tells us the percentage of values that fall below a particular value. On the other hand, a z-score measures how many standard deviations a data point is away from the mean of a dataset.
To convert a z-score to a percentile, we use a standard normal table and find the cumulative probability to the left of the z-score. We then multiply the probability by 100 to get the result.
In general, the formula to convert a z-score to a percentile using the standard normal table (z-table) is:
Percentile = Φ(z) × 100
where:
- Φ(z) is the cumulative probability to the left of the z-score
- z is the given z-score
Want a step-by-step approach? Use these steps to find a percentile from a z-score using a cumulative z-table.
- Select the correct z-table. Use a positive z-table for positive z-scores and a negative z-table for negative z-scores
- Separate the z-score into the ones and first decimal place (e.g.,
1.2) and the hundredths digit (e.g.,0.03for1.23). - Look down the side of the z-table for the row matching your ones and first decimal place.
- Look across the top of the table for the column matching your hundredths digit.
- Find the cell where that row and column meet to get the cumulative left-tail area (probability).
- Multiply the decimal value from the table by 100 to turn it into a percentile
Example 1: Convert a Positive Z Score to a Percentile
A student takes a standardized examination and receives a z-score of 1.28. Assuming the examination scores follow a normal distribution, what percentile is the student’s score?
Solution
From the question, the z-score is: z = 1.28
We can now find the percentile using a cumulative z-table as follows:
Step 1. Select the correct z-table.
Since z = 1.28 is positive, we use the positive z-table.
Step 2. Separate the z-score into the row and column values.
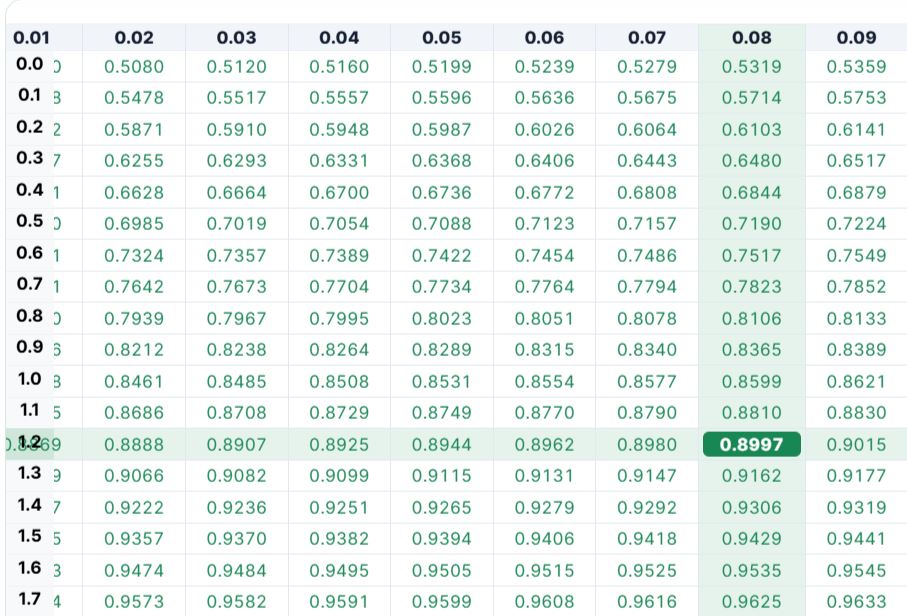
Separating 1.28 into ones and the first decimal, the row value becomes 1.2. The hundredth digit is 0.08
Step 3. Look down the side of the positive z-table for 1.2.
Step 4. Look across the top of the table for 0.08.
Step 5. Find the value where the 1.2 row and 0.08 column meet.
From the cumulative positive z-table, the two values meet at 0.8997. In other words, the area to the left of z = 1.28 is 0.8997 (i.e., P(Z ≤ 1.28) = 0.8997). The table below shows the probability using a positive z-table.
Step 6. Multiply the probability by 100 to convert it into a percentile.
Therefore, percentile = 0.8997 × 100 = 89.97. This implies that a z-score of 1.28 corresponds to approximately the 89.97th percentile. In other words, the student’s score is higher than approximately 89.97% of scores in the normally distributed population.
You can also verify the result with our calculator. Simply enter 1.28 as the z-score and click calculate. The calculator will instantly return the percentile as: Percentile = 89.97th
Example 2: Convert a Negative Z Score to a Percentile
Suppose a standardized assessment produces a z-score of -1.25 for a particular score. Find the corresponding percentile.
Solution
From the question, the z-score is: z = -1.25
We can now find the percentile using a cumulative z-table as follows:
Step 1. Select the correct z-table.
Since z = -1.25 is negative, we use the negative z-table.
Step 2. Separate the z-score into the row and column values.
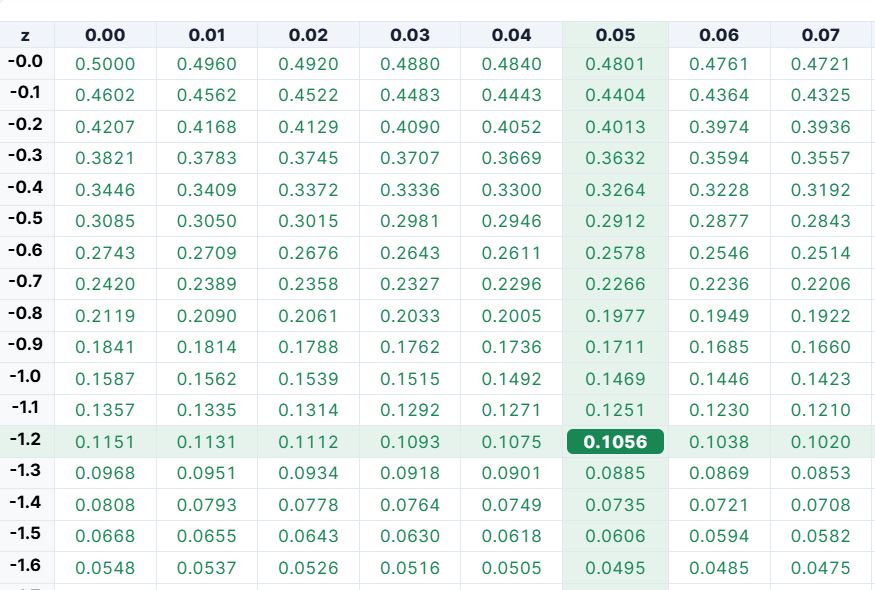
Separating -1.25 into the ones and first decimal, the row value becomes -1.2. The hundredths digit is 0.05.
Step 3. Look down the side of the z-table for -1.2.
Step 4. Look across the top of the table for 0.05.
Step 5. Find the value where the -1.2 row and 0.05 column meet.
From the cumulative negative z-table, the two values meet at 0.1056. In other words, the area to the left of z = -1.25 is 0.1056 (i.e., P(Z ≤ -1.25) = 0.1056). The table below shows the probability using a negative z-table.
Step 6. Multiply the probability by 100 to convert it into a percentile.
Therefore, percentile = 0.1056 × 100 = 10.56. This implies that a z-score of -1.25 corresponds to approximately the 10.56th percentile. In other words, approximately 10.56% of scores in the normally distributed population fall below this score.
You can also verify the result with our calculator. Simply enter -1.25 as the z-score and click calculate. The calculator will instantly return the percentile as: Percentile = 10.56th
How to Convert Z to Percentile Using Excel
You can also convert a z-score to a percentile in Excel using the NORM.S.DIST function.
The formula is: =NORM.S.DIST(z,TRUE)*100
The TRUE argument tells Excel to return the cumulative probability to the left of the z-score, which is the probability we need to determine the percentile.
For example, to find the percentile for z = 1.28 in Excel, just replace z with 1.28 in the above formula. Thus, the formula becomes: =NORM.S.DIST(1.28,TRUE)*100.
Once you hit the Enter key on your keyboard, Excel will instantly return the correct percentile as 89.97. As you can see, using our z-score to percentile calculator, a z-table, or the Excel formula will yield the same results.
Z score to Percentile chart
The table below shows the approximate percentiles for the most common z-scores
| Z Score | Percentile |
|---|---|
| -3.00 | 0.13th |
| -2.50 | 0.62th |
| -2.00 | 2.28th |
| -1.645 | 5.00th |
| -1.28 | 10.03th |
| -1.00 | 15.87th |
| -0.50 | 30.85th |
| 0.00 | 50.00th |
| 0.50 | 69.15th |
| 1.00 | 84.13th |
| 1.28 | 89.97th |
| 1.645 | 95.00th |
| 1.96 | 97.50th |
| 2.00 | 97.72th |
| 2.326 | 99.00th |
| 2.50 | 99.38th |
| 3.00 | 99.87th |
Note. If the z score you need is not shown in the table, enter it into the z to percentile calculator above to find the corresponding percentile.
Frequently Asked Questions
A z score to percentile calculator converts a z score into its corresponding percentile under the standard normal distribution. This calculator also shows the cumulative probability below the z score, shades that area on a normal distribution graph, and explains the conversion step by step.
Find the cumulative probability to the left of the z score using the standard normal distribution, then multiply the probability by 100.
A z score of 1 corresponds to approximately the 84.13th percentile. This means about 84.13% of values in a standard normal distribution fall below z = 1.
The z score corresponding to the 95th percentile is approximately 1.6449. You can find z scores from known percentiles using our percentile to z calculator.
For the standard z-score-to-percentile conversion, the percentile is the cumulative area to the left of the z score. For example, if 90% of the standard normal distribution lies to the left of a z score, that z score is at the 90th percentile.
