
How to Use the Quartile Calculator
This quartile calculator helps you find the first quartile (Q1), second quartile (Q2), and third quartile (Q3) for any dataset. To use the calculator:
- Enter your data values in the data input field. You should separate values using commas, spaces, tabs, or line breaks. The calculator also allows you to copy and paste values directly from Excel, Google Sheets, or text documents.
- Click Calculate.
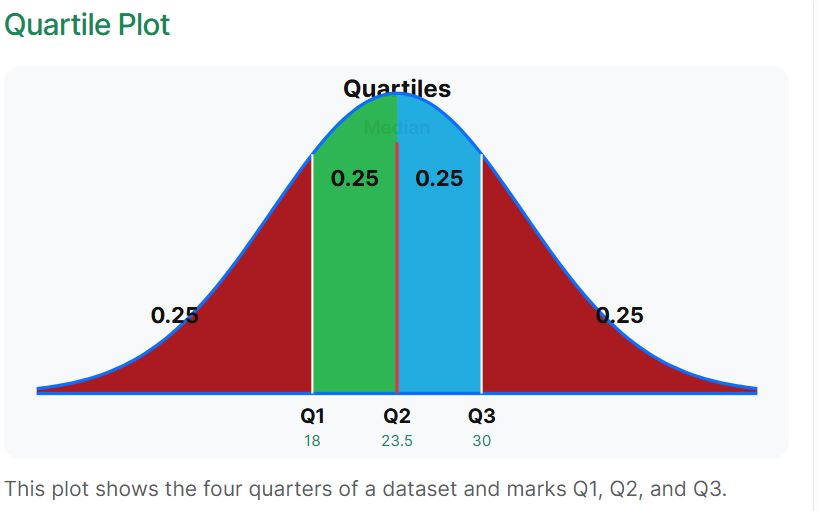
The calculator will instantly return the quartiles (Q1, Q2, and Q3) and a quartile plot showing their positions on a histogram. It will also provide a clear, step-by-step solution to help you learn how to compute these quartiles manually, using your own dataset.
Want to find the interquartile range of your dataset instead? Use the IQR calculator for instant results and a clear, step-by-step solution.
What is a quartile?
A quartile is a statistical measure that divides a ranked data set into four equal quarters, with each section representing 25% of the data. The three main quartiles are:
- First Quartile (Q₁) / Lower Quartile. This represents the middle value of the lower half of the ranked dataset. It is also called the 25th percentile because 25% of the data falls below this point.
- Second Quartile (Q₂). The second quartile is basically the Median of a dataset. It is also referred to as the 50th percentile because it cuts the ordered data exactly in half. In other words, 50% of the data either falls below or above this value.
- Third Quartile (Q₃) / Upper Quartile. This represents the median value of the upper half of the ordered dataset. It is also known as the 75th percentile because 75% of the ordered data falls below this value.
How to Find Quartiles
To find quartiles, follow these steps:
- Arrange the data in ascending order.
- Find the median of the ordered dataset to get Q2
- Find the median of the lower half of the ordered data to get Q1
- Find the median of the upper half of the ordered dataset to get Q3
Example
A researcher records the number of minutes taken by 10 students to complete a task:
14, 18, 12, 20, 25, 22, 30, 28, 35, 40
Find the quartiles.
Solution
To find the quartiles for the dataset manually, follow these steps:
Step 1: Arrange the data in ascending order.
Arranging the values from smallest to largest gives: 12, 14, 18, 20, 22, 25, 28, 30, 35, 40
Step 2: Find the median of the entire dataset
The median of the entire dataset gives you the second quartile (Q2). Since there are 10 values, which is an even number, the median is the average of the two middle values.
In this case, the two middle values are 22 and 25. Therefore, the second quartile, Q2 = (22 + 25) / 2
= 23.5
Need to learn more about how to find the median? Use the median calculator to get instant results with a clear step-by-step solution.
Step 3: Find the median of the lower half of the ordered data to get Q1
The median of the lower half of the ordered dataset gives you the first quartile (Q1).
The lower half of the ordered dataset is: 12, 14, 18, 20, 22. Since there are 5 values in the lower half, which is odd, the middle value is 18.
Therefore, the lower quartile, Q1 = 18
Step 4: Find the median of the upper half of the ordered dataset to get Q3
The median of the upper half of the ordered dataset is the third quartile (Q3). The upper half of the ordered data is: 25, 28, 30, 35, 40. Since there are 5 values in the upper half, which is odd, the middle value is the value at the center.
Therefore, the upper quartile, Q3 = 30
In summary, the three quartiles are:
- Q1 = 18
- Q2 = 23.5
- Q3 = 30
Want to verify these results using our quartile calculator? Follow these steps:
- Copy and paste the dataset into the data input field
- Click calculate
The calculator will instantly return similar results and display the following quartile plot.
Frequently Asked Questions
This quartile calculator finds the first quartile (Q1), second quartile or median (Q2), and third quartile (Q3) of a dataset. It also shows a clear step-by-step solution.
Q1, also called the first quartile or lower quartile, is the median of the lower half of an ordered dataset. It marks the point below which about 25% of the data values fall.
Q2 is the second quartile, which is the same as the median. It divides the ordered dataset into two equal halves.
Q3, also called the third quartile or upper quartile, is the median of the upper half of an ordered dataset. It marks the point below which about 75% of the data values fall.
The calculator first arranges the data in ascending order. It then finds Q2 as the median of the full dataset, Q1 as the median of the lower half, and Q3 as the median of the upper half.
No. When the dataset has an odd number of values, this calculator excludes the overall median when splitting the data into the lower and upper halves. This is a common method used in many introductory statistics courses.
