
How to Use the One-Sample T-Test Calculator
This calculator helps you quickly perform a one-sample t-test using either summary data or raw data values. If you already have summary data, follow these steps:
- Select the alternative hypothesis that matches your research question.
- Enter the hypothesized population mean, μ₀.
- Choose the Summary Data option
- Enter the required sample information including the sample mean (x̄), sample standard deviation (s), and sample size (n).
- Enter the significance level, α.
- Click Calculate.
However, if you want to perform a one-sample t-test for raw data, follow these steps:
- Select the alternative hypothesis that matches your research question.
- Enter the hypothesized population mean, μ₀.
- Choose the Raw Data option
- Enter the raw data values. You can copy-paste the values from Excel, Google Sheets, or text documents. The raw data input field accepts values separated using commas, spaces, tabs, or line breaks.
- Enter the significance level, α.
- Click Calculate.
On hitting the “Calculate” button, the calculator will instantly return the t-test statistic, the p-value, and the critical value. You’ll also see a clear, step-by-step solution showing you how to perform the test using the 6 steps of hypothesis testing.
What Is a One Sample T Test?
A one-sample t test is a statistical hypothesis test used to determine whether the mean of one population differs significantly from a specified value. Unlike the one-sample z-test, which requires a known population standard deviation, the one-sample t-test uses the sample standard deviation as an estimate of the population standard deviation.
The null hypothesis for this test is generally written as: H0: μ = μ0. However, the alternative hypothesis may be:
- H1: μ ≠ μ0 (two-tailed test)
- H1: μ > μ0 (Right-tailed test)
- H1: μ < μ0 (Left-tailed test)
Note. μ0 is the population mean specified in the claim
Wondering whether your problem can be solved using the one-sample t-test? The test may be suitable if you want to test whether:
- The average examination score differs from a national average
- The mean lifetime of a product exceeds the advertised value
- The average amount in packages differs from the value printed on the label
- The mean blood pressure of a population differs from a clinical reference value
When to Use a One-Sample T Test?
Use a one-sample t test when you want to compare the mean of one quantitative variable with a known, expected, or hypothesized value.
The test is appropriate when:
- You have one sample from one population
- The variable is quantitative
- The observations are independent
- The population standard deviation, σ, is unknown
- The sample standard deviation, s, is used to estimate σ
- The population is approximately normal, or the sample is sufficiently large for the procedure to be reasonably robust
The most important distinction is that the population standard deviation is unknown.
Tip. A one-sample t-test is not limited to small sample size (n ≤ 30). It is still appropriate even with a large sample size, especially when the population standard deviation is unknown, because as the sample size increases, the t distribution becomes similar to the standard normal distribution.
One Sample T Test Assumptions
Before performing a one-sample t-test, make sure the following assumptions are met:
- The data values are quantitative (continuous where mean is meaningful)
- Individual observations are independent of each other
- The sample is randomly selected
- The data are approximately normally distributed
Note. When the normality assumption is seriously violated, you should use the one-sample sign test, which is a non-parametric equivalent test for a one-sample t-test.
One Sample T Test Formula
The one-sample t-statistic formula is:
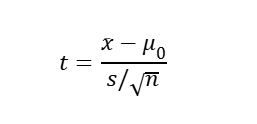
Where:
- t is the test statistic
- x̄ is the sample mean
- μ₀ is the hypothesized population mean
- s is the sample standard deviation
- n is the sample size
The denominator (s/√n) is the estimated standard error of the sample mean. You can quickly find this value using the standard error of the mean calculator.
How to do a one-sample t test
You can easily find the one-sample t-test by hand by using the 6-steps of hypothesis testing. Here’s an example.
A battery manufacturer claims that a new battery lasts more than 100 hours on average. A random sample of 16 batteries has a mean lifetime of 104 hours and a sample standard deviation of 8 hours. At the 0.05 significance level, is there enough evidence to support the manufacturer’s claim?
Solution
To conduct the test, follow these steps.
Step 1: State the hypotheses
The claim is that the average battery life is greater than 100 hours. Therefore, this is a right-tailed test.
This means we need to test the hypotheses:
- H0:μ = 100
- H1:μ > 100
Step 2: State the significance level
From the question, the significance level is α = 0.05
Step 3: Calculate the test statistic
By definition, the one-sample t-statistic formula is: t = (x̄-μ₀)/(s/√n)
From the question, we know that:
- Sample mean, x̄ = 104
- Hypothesized mean, μ₀ = 100
- Sample standard deviation, s = 8
- Sample size, n = 16
Substituting the values into the formula gives:
t = (104-100)/(8/√16)
= 4/2
= 2.00
Therefore, the one-sample t-test statistic is: t =2.00
Step 4: Find the p-value and Critical value
Using a t-score to p-value calculator, the right-tailed p-value is 0.031973. Additionally, the right-tailed critical value using the t-critical value calculator is: t0.05, 15 = 1.7531.
Recall. The degrees of freedom formula for a one-sample t-test is: df = n-1, where n is the sample size.
Want to quickly calculate the degrees of freedom without mastering formulas? Use the degrees of freedom calculator.
Step 7: Make the decision
Since the p-value (0.031973) is less than the 0.05 significance level, we reject the null hypothesis. Also, using the critical value approach, we can see that the absolute test statistic value (2.00) is greater than the t-critical value (1.7531), which indicates we reject the null hypothesis.
Step 8: Write the conclusion
At the 0.05 significance level, there is enough evidence to conclude that the mean battery life is greater than 100 hours.
Frequently Asked Questions
It compares the mean of one sample with a hypothesized population mean when the population standard deviation is unknown. You’ll get the t statistic, degrees of freedom, p-value, critical value, and a step-by-step solution showing you how to perform the test using the 6 steps of hypothesis testing.
Yes. Select Raw Data and enter the individual observations. The calculator will find the required sample statistics and perform the test accordingly.
For a one-sample t-test, the degrees of freedom formula is: df = n-1, where n is the sample size.
Yes. A one-sample t test is not restricted to small samples. When the population standard deviation is unknown, the t procedure remains appropriate because with increasing degrees of freedom, the t distribution becomes very close to the normal distribution.
