
How to Use the Two Proportion Z Test Calculator
This calculator helps you perform a two proportion z-test to determine whether the proportions from two independent groups differ significantly. You can use this calculator if you have either raw data or summary data.
To use the calculator:
- Select the alternative hypothesis that matches your research question.
- Enter the significance level, α.
- Choose Summary Data or Raw Binary Data.
- Enter the results for both samples.
- Click Calculate.
The calculator will instantly perform the two sample proportion hypothesis test and return the test statistic, p-value, and critical value. It will also provides a clear, step-by-step solution showing you how the test was performed, from stating hypothesis to making right conclusion.
Note. For raw data, you should convert string values to binary (1, 0) and then enter the values into the input fields. In this case, 1 represents success, whereas 0 represents a failure.
Tip. This tool also checks whether the sample is large enough to use the normal approximation rather than the exact binomial test.
Recall. In hypothesis testing, the word success simply refers to the outcome of interest rather than a positive result.
Want to perform a one proportion test instead? Use the single proportion z test calculator.
What Is a Two Proportion Z Test?
A two proportion z test is a hypothesis test used to compare the population proportions of two independent groups. It helps you determine whether the observed difference between two sample proportions is large enough to provide evidence of a real difference between the corresponding population proportions.
For example, the test can help determine whether:
- Two advertisements have different conversion rates
- Two treatments have different recovery rates
- Two schools have different examination pass rates
- Two factories have different defect rates
- Two groups have different levels of support for a policy
- Two website designs have different click-through rates
This hypothesis test is also referred to as a two sample proportion test, two proportions test, two independent proportions test, or z test for the difference between two proportions.
Hypotheses in Two Samples Proportion Test
Let:
- p1 represent the population proportion for Group 1
- p2 represent the population proportion for Group 2
We want to test the null hypothesis: H0:p1 = p2 (the two proportions are equal). This can sometimes be written as: H0:p1 – p2 = 0.
The alternative hypothesis depends on whether the question is directional or non-directional. Therefore, the alternative hypothesis can be either of these:
- Two-tailed: H1:p1 ≠ p2 (The two proportions are different)
- Right-tailed: H1:p1 > p2 (The first population proportion is greater than the second one)
- Left-tailed: H1:p1 < p2 (The first population proportion is less than the second one)
Note. The order of the groups matters in a directional test (left-tailed or right-tailed test). As such, reversing Sample 1 and Sample 2 reverses the sign of the z statistic and changes the direction of the research hypothesis.
When to Use a Two Proportion Z Test?
Use this test when you want to compare one binary outcome across two independent groups.
The test is appropriate when:
- There are two separate samples or groups
- Each observation belongs to only one group
- The outcome has two possible categories
- Observations within and between the groups are independent
- The samples reasonably represent the populations of interest
- The expected numbers of successes and failures are sufficiently large.
Tip. Two independent proportion procedures are designed for unrelated groups. If the two proportions are paired or matched binary data, the McNemar’s test is the most appropriate test.
Two Proportion Test Assumptions
Before performing a two proportion test, make sure the following conditions are met.
- The outcome must be binary in nature e.g., Yes or No, Pass or Fail, etc.
- The two sample proportions should be independent
- Observations with each sample proportion should be independent
- The sample should be randomly selected from the target population
- The normal approximation conditions must be met. The conditions are: np̂pooled ≥ 10 and n(1-p̂pooled) ≥ 10
Note. Some books recommend the minimum to be at least 5, while others recommend 10. Using 10 provides a more cautious check of the normal approximation.
If this condition is not met for your data, the two-proportion z-test calculator will display a warning telling you that the normal approximation is not appropriate. In this case, a Fisher’s exact test may be more appropriate.
Two Proportion Z Test Formula
The two-proportion z statistic formula is:
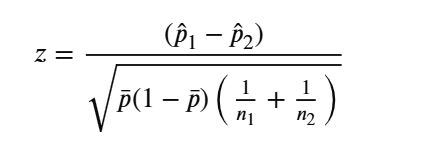
Where:
- p̂1 is the sample proportion of the first group. Its formula is: p̂1= x1/n1, where x1 is the number of successes in the first group and n1 is the sample size of the first group.
- p̂2 is the sample proportion of the second group. Its formula is p̂2 = x2/n2, where x2 is the number of successes in the second group and n2 is the sample size of the second group.
- p̄ is the pooled proportion, which is calculated using the formula: p̄ = (x1 +x2)/(n1+n2)
Example
An online retailer wants to compare the conversion rates of two checkout page designs. Of the 150 customers shown Design A, 96 complete a purchase. Of the 150 customers shown Design B, 72 complete a purchase. At the 0.05 significance level, is there evidence that the two checkout designs have different population conversion rates?
Solution
To perform a two proportion z-test manually, follow these steps:
Step 1: State the hypotheses
The question asks whether the conversion rates are different in either direction. Therefore, this is a two-tailed test.
The hypotheses are:
- H0:p1=p2
- H1: p1≠ p2
Where:
- p₁ is the population conversion rate for Design A
- p₂ is the population conversion rate for Design B
Step 2: State the Significance Level
From the question, we need to test the hypothesis at 0.05 significance level. Therefore, α = 0.05
Step 3: Calculate the z statistic
From the question, we can summarize the information as follows:
- Number of successes for Group 1, x₁ = 96
- Sample size for Group 1, n₁ = 150
- Number of successes for Group 2, x₂ = 72
- Sample size for Group 2, n₂ = 150
Before applying the two-proportion z-statistic formula, we need to compute sample proportion for each group and the pooled proportions.
Therefore, for Design A, p̂1= x1/n1
= 96/150
= 0.64
For Design B, p̂2 = x2/n2
= 72/150
= 0.48
Next, we need to find the pooled proportion. By definition, pooled proportion, p̄ = (x1 +x2)/(n1+n2)
= (96 +72)/(150 +150)
=168/300
= 0.56
Since we now have all the required parameters, we can apply the two proportion z statistic formula.
By definition, z = (p̂1-p̂2)/√[p̄ (1-p̄ )(1/n1+1/n2)]
Substituting the values into the formula gives:
z = (0.64 – 0.48)/√[0.56(1-0.56)(1/150+1/150)]
= 0.16/√0.003285333
=2.7915
Step 4: Find the p-value and Critical Value
Because this is a two-tailed test, the p-value includes extreme results in both tails of the standard normal distribution. Using the p-value from z calculator, the two-tailed p-value is 0.005247.
Also, using a standard normal table or a z-critical value calculator, the two-tailed critical values at α = 0.05 is: Z0.05/2 = ±1.96
Step 5: Make the decision
Since the p-value (0.005247) is less than the 0.05 significance level, we reject the null hypothesis. Also, using the critical value approach, we see that the z-statistic (2.7915) is greater than the absolute critical value (1.96), suggesting that we reject the null hypothesis.
Step 6: Write the conclusion
At the 0.05 significance level, there is sufficient evidence to conclude that the two checkout page designs have different population conversion rates.
Verifying Using the calculator
Want to verify the result using the two-proportion z-test calculator? Follow these simple steps:
- Select the alternative hypothesis as: H1: p1≠ p2
- Enter 0.05 as the significance level
- Select the summary data option
- Enter x1 = 96, n1 = 150, x2 = 72 and n2 = 150
- Click Calculate
The calculator will yield similar results, as follows:
- Test statistic: z = 2.7915
- P-value: 0.005247
- Critical value: ±1.96
You’ll also see how the problem was solved using the 6-steps of hypothesis testing.
Frequently Asked Questions
It compares the population proportions of two independent groups. The calculator returns the z statistic, p-value, and critical value and show you exactly how to perform the hypothesis test by hand.
Interpret the z-test result cautiously and consider an exact method, such as Fisher’s exact test. Small samples or proportions near 0 or 1 can make the normal approximation unreliable.
Yes, when each participant is independently assigned to one version and the outcome is binary, such as clicked or did not click, converted or did not convert, or purchased or did not purchase. The test evaluates whether the observed conversion proportions provide evidence of different population rates.
