
Want to perform a two-proportion test instead? Use the two proportion test calculator.
How to Use the One Proportion Z Test Calculator
This calculator will help you perform a hypothesis test to determine whether a single categorical sample’s proportion differs significantly from a known or hypothesized population proportion. As such, the tool can also be referred to as the one-sample proportion test calculator.
To use the calculator:
- Select the alternative hypothesis that matches your research question.
- Enter the hypothesized population proportion, p0.
- Choose Summary Data or Raw Binary Data.
- Enter your sample information.
- Enter the significance level, α.
- Click Calculate.
The calculator will instantly return the test statistic, p-value, and critical value. You’ll also see a clear, step-by-step solution to help you learn how to conduct a one-sample proportion test by hand, using the 6-steps of hypothesis testing.
Note. For raw data, the calculator allows you to enter raw values separated using commas, spaces, tabs, or even line breaks. You can also copy-paste values directly from Excel, Google Sheets, and text documents.
Summary vs Raw Data
When using the calculator, it might be confusing to know which option to use. The decision is simple:
Use a summary data option if you already know the number of successes (x), sample size (n), and the hypothesized proportion (p0). However, if you’re working with individual outcomes rather than summarized counts, you should select the raw data option and enter these values, separating them using commas, spaces, semicolons, or new lines.
Remember: In statistics, a “success” simply means the outcome of interest rather than the positive results.
What Is a One-Proportion Z Test?
A one-proportion z-test, also known as the one-sample proportion test, is a hypothesis test used to determine whether an observed sample proportion differs significantly from a hypothesized population proportion.
For example, you could use the test to determine whether:
- More than 60% of customers prefer a new product
- A manufacturing defect rate is below 5%
- The proportion of voters supporting a candidate differs from 50%
- A treatment success rate exceeds an established benchmark
- The percentage of students who pass an examination has changed
The test compares the sample proportion, p̂, with the value stated in the null hypothesis, p0. Therefore, the null hypothesis for the test is: H0: p = p0
However, the alternative hypothesis can be either of these:
- Two-tailed: H1: p ≠ p0
- Right-tailed: H1: p > p0
- Left-tailed: H1: p < p0
When to Use a One-Sample Proportion Test?
Use this test when you have one sample of binary or categorical outcomes and want to compare its proportion with a specified population value.
The procedure is appropriate when:
- The data represent two possible outcomes, such as success/failure or yes/no
- The observations are independent
- The sample is reasonably representative of the population
- The number of observations is fixed
- The probability of the outcome is assumed to be constant under the null hypothesis
- The sample is large enough for the normal approximation. In this case, np0 ≥ 10 and n(1−p0) ≥ 10
One Proportion Z Test Formula
The one-proportion t-test formula is:
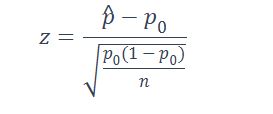
Where:
- z is the test statistic
- p̂ is the sample proportion
- p0 is the hypothesized population proportion
- n is the sample size
Tip: p̂ is the sample proportion, which is calculated using the formula: p̂ = x/n, where x is the number of successes and n is the sample size
One Proportion Z Test Example
A training provider claims that more than 70% of participants complete its online certification program. A random sample of 100 participants shows that 82 completed the program. At the 0.05 significance level, is there enough evidence to support the provider’s claim?
Solution
To solve the above problem, we follow these steps:
Step 1: State the hypotheses
The claim is that the population completion proportion is greater than 0.70. Therefore, this is a right-tailed test.
The hypotheses are:
- H0: p = 0.70
- H1: p > 0.70
Step 2: State the significance level
From the problem, the significance level is α = 0.05
Step 3: Check the normal-approximation condition
For a normal approximation to be appropriate, the following two conditions must be met.
- np0 ≥ 10
- n(1−p0) ≥ 10
From the question, n = 100 and p0 = 0.70
Therefore:
np0 =100(0.70)
=70
Similarly, n(1−p0)=100(1−0.70)
= 30
Since both values are at least 10, the normal approximation condition is met, and we can proceed with the test. If this condition is not satisfied, you should use the exact binomial test instead.
Step 4: Calculate the Test Statistic
By definition, the one-sample proportion test statistic formula is: z = (p̂ -p0)/√(p0(1-p0)/n)
In this case, p̂ = x/n, where x = 82 and n = 100. Substituting the values gives: p̂ = 82/100
= 0.82
Therefore, the test statistic value is: z = (0.82-0.70)/√(0.70(1- 0.70)/100)
= 0.12/√0.0021
= 2.6186
Step 5: Find the p-value & Critical Value
Because this is a right-tailed test, the p-value is the area to the right of z = 2.6186. Using the p-value from z calculator, the p-value = 0.004414.
Also, using a z-table or a z-critical value calculator, the right-tailed critical value for the test is: z0.05 = 1.645
Step 6: Make the decision
Since the p-value (0.004414) is less than the 0.05 significance level, we reject the null hypothesis. Also, since the z-statistic (2.6186) is greater than the critical value (1.645), we reject the null hypothesis.
Tip: The p-value and critical-value approaches should produce the same decision when they use the same α and alternative hypothesis.
Step 7: Write the conclusion
At the 0.05 significance level, there is sufficient evidence to conclude that more than 70% of participants complete the online certification program.
Frequently Asked Questions
This calculator helps you determine whether a single sample’s success rate differs significantly from a known or hypothesized population benchmark. It gives you the test statistic, p-value, and critical value. You’ll also see a clear, step-by-step solution, showing you how the one-sample proportion test is done.
A hypothesis test calculates probabilities under the assumption that the null hypothesis is true. Therefore, the null-hypothesis standard error is based on p0 rather than the observed sample proportion.
This is the fraction of a sample that has a specific characteristic. It is often denoted as p̂ (read as “p-hat”) and is calculated by dividing the number of individuals of interest (x) by the total sample size (n). Hence, the sample proportion formula is p̂ = x/n, where x is the number of successes and n is the sample size.
Consider using an exact binomial test. This is especially important with a small sample or a hypothesized proportion close to 0 or 1.
