
How to Use the R Critical Value Calculator
This calculator helps you find the critical value for a Pearson’s correlation test. To use the calculator:
- Select the test type. Choose two-tailed, left-tailed, or right-tailed.
- Enter the significance level, α
- Enter the sample size, n. This is the number of paired observations used to calculate Pearson’s r.
- Click Calculate.
The calculator will instantly return the r critical value and a decision rule telling you when to reject the null hypothesis. It also provides a clear, step-by-step solution showing you how to find the r critical value manually.
What Is an R Critical Value?
An r critical value is the cutoff used to determine whether a sample Pearson correlation coefficient is statistically significant. Specifically, we compare the calculated Pearson’s correlation (observed r) with the r-critical value and make decisions about the null hypothesis (H0) as follows:
- Reject the null hypothesis (H0) if the absolute value of the calculated correlation coefficient, |r|, is greater than the |rcritical|.
- Fail to reject the null hypothesis (H0) if the absolute value of the calculated correlation coefficient, |r|, is less than or equal to the |rcritical|.
Note. Most correlation tests are two-tailed unless the question requires you to test a well-known relationship.
The two-tailed hypotheses for correlation are:
- H₀: ρ = 0 (there is no correlation between variables)
- H₁: ρ ≠ 0 (there is a significant correlation between variables)
How to Find Critical Value of r
To find the critical value of r manually (without using tables):
- Calculate the degrees of freedom (df)
- Determine the significance level (α)
- Find the t-critical value using a t distribution table
- Convert the t-critical value to r-critical value
Example
A sports scientist wants to know if there is a significant linear relationship between the number of hours athletes train per week and their running speed in a 100-meter sprint. The sample size was 18 athletes, and they want to test this relationship at the 5% level of significance. Find the critical value for the test.
Solution
The question does not explicitly state the direction of the expected relationship. As such, this is a two-tailed test because we want to test whether there is a significant relationship between the variables, regardless of their direction.
To find the critical value of r by hand, follow these steps:
Step 1. Calculate the degrees of freedom
By definition, the degrees of freedom formula for a Pearson’s correlation test is: df = n-2
In this case, the sample size, n = 18. Therefore, df = 18-2
= 16
Step 2. Determine the significance level
From the question, we want to test the hypothesis at a 5% significance level. Therefore, the significance level, α = 0.05
Step 3. Find the t-critical value
Since the test is two-tailed, we need to find the two-tailed t-critical value with α = 0.05 and df = 16. Using the t-table, t0.05/2, 16 = 2.120.
Step 4. Convert the t-critical value to an r-critical value
To convert the t-critical value to an r-critical value (Pearson correlation), we use the following r-critical value formula:
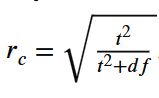
Where:
- rc is the r-critical value
- t is the t-critical value
- df is the degrees of freedom
Substituting the values into the formula gives:
rc = √[2.1202/(2.1202+ 16)]
= √(4.4944/20.4944)
=√0.2193
rc = 0.4683
Therefore, the r-critical value for the test is ± 0.4683
You can also verify these results using the calculator. To do that:
- Select two-tailed as the test type
- Enter n = 18 and α = 0.05
- Click calculate
The calculator will instantly return the critical value of r as: r = ±0.4683.
Notice. The manual steps and the calculator yield similar results. Thus, it is up to you to choose the most appropriate method depending on your needs.
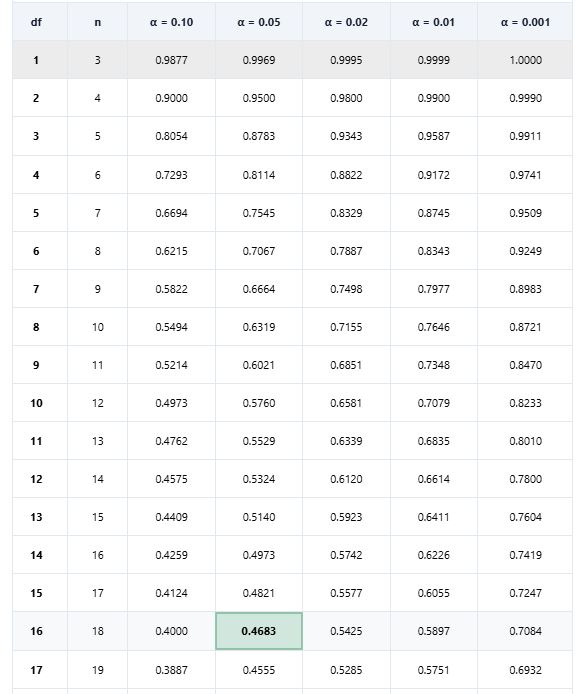
Alternatively, you can quickly look up the r-critical value from the r-critical value table. You simply need to use a two-tailed table and look up the value at the intersection of df = 16 and α = 0.05. This should give you similar results, as shown below.
Should I use a One-Tailed or Two-Tailed Test?
Choosing between a one-tailed or a two-tailed test in Pearson’s correlation depends on the nature of the alternative hypothesis. A simple rule of thumb is to always use a two-tailed test if the question does not explicitly state the direction of the hypothesis to be tested.
The table below provides a quick summary to help you choose the correct test type.
| Test type | Alternative hypothesis | Research question | Decision rule |
|---|---|---|---|
| Two-tailed | H₁: ρ ≠ 0 | Is there a positive or negative correlation? | Reject H₀ when |r| meets or exceeds the critical magnitude |
| Right-tailed | H₁: ρ > 0 | Is there a positive correlation? | Reject H₀ when r meets or exceeds the positive critical value |
| Left-tailed | H₁: ρ < 0 | Is there a negative correlation? | Reject H₀ when r meets or falls below the negative critical value |
Frequently Asked Questions
An r critical value is the cutoff used to determine whether a Pearson correlation coefficient is statistically significant. If the calculated correlation reaches or exceeds the critical value in the required direction, you reject the null hypothesis of no population correlation.
To find the critical value of r, identify the significance level, test type, and sample size. The degrees of freedom are calculated as df = n − 2. The corresponding t critical value is then converted to an r critical value using the formula: rc = tcrit/√(tcrit² + df)
Use a two-tailed test when the hypothesis predicts a correlation but does not specify whether it will be positive or negative. However, if the hypothesis predicts a positive correlation or negative correlation, you should use a one-tailed test.
As the sample size increases, the magnitude of the r critical value generally decreases. This means that a smaller observed correlation may be statistically significant with a large sample. However, statistical significance does not necessarily mean that the relationship is strong or practically important.
No. This calculator is designed for testing the significance of Pearson’s product-moment correlation coefficient. Spearman’s rank correlation uses a different significance procedure, especially for small samples or datasets containing tied ranks.
