
T-Table | T-Distribution Table
What Is a T Table?
A t-table is a reference table mainly used in statistical hypothesis testing and confidence intervals involving t-tests to find the t-critical values. It is sometimes called the t-critical value table, t distribution table, or the Student’s t table.
In hypothesis testing, we compare the t-test statistic with the t-critical value to determine whether or not to reject the null hypothesis (H0). In this case, we make decisions as follows:
- Reject the null hypothesis (H0) if |t-statistic| is greater than the |tcritical|
- Fail to reject the null hypothesis (H0) if |t-statistic| is less than or equal to the |tcritical|
T critical values are also used when constructing confidence intervals for t-tests. In this case, a t-critical value is multiplied by the standard error to get the margin of error.
How to Use this Interactive T Distribution Table
This t distribution table makes it easier to get the correct critical value for one-sided and two-sided t-tests, without manual lookup. To use the table:
- Choose whether your test is one-tailed or two-tailed.
- Choose the significance level, α.
- Choose the degrees of freedom, df.
- Click the “Find Critical Value” button
The table will instantly return the correct t-critical value and highlight the value within the table.
How to Read a T Table
Reading the table involves finding the t-critical values using a t-table chart. To manually read the table:
- Identify the right t-distribution table based on the test type. The two common tables are the one-sided table and two-sided table.
- Identify the degrees of freedom (df) and Significance level (α)
- Using the correct table (one-sided/two-sided table), find the value where the α column meets the df row. This is the t-critical value.
Example 1. Right-Tailed Test
A manufacturer claims their lightbulbs last more than 1000 hours. A sample of (n=16) lasts an average of 1020 hours. Find the critical value for a right-tailed test at (α =0.05).
Solution
To find the correct t-critical value for this test, follow these steps:
Step 1. Identify the correct table
From the question, we want to determine whether the bulbs will last more than 1000 hours. In other words, we want to test the hypothesis:
H0: μ = 1000 hours
H1: μ > 1000 hours
The alternative hypothesis shows that this is a right-tailed test. As such, we should use a one-sided t distribution table.
Step 2. Identify the degrees of freedom and significance level
From the question, the significance level, α =0.05.
Since this is a one-sample t-test, the degrees of freedom formula is: df = n-1, where n is the sample size.
Therefore, df = 16 -1
= 15
Want a tool that quickly computes the degrees of freedom for you? Use the df calculator.
Step 3. Using a one-sided table, find the value where the α column meets the df row.
From the one-sided table, the α = 0.05 column meets the df = 15 row at 1.753.
Therefore, the right-tailed t-critical value is: t0.05, 15 = 1.753. See the results below.
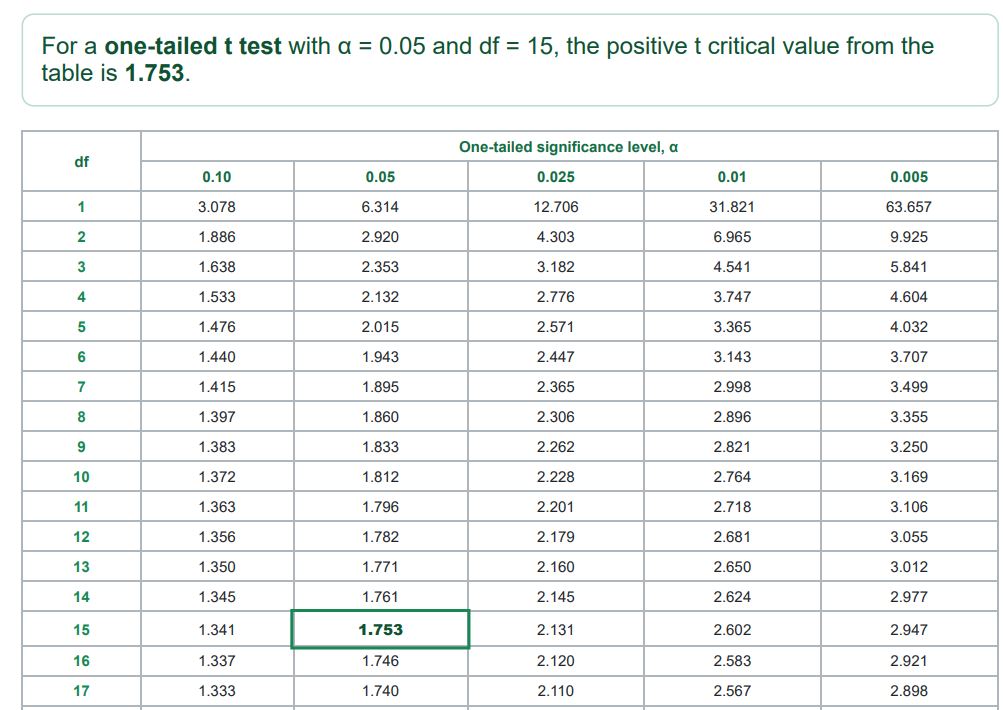
Alternatively, you can use our interactive t distribution table to quickly find the same value. Just follow these simple steps:
- Select one-sided
- Select α = 0.05 and df = 15
- Click the “Find Critical Value” button
The table will automatically move you to where the α =0.05 column and df = 15 row meet. In this case, the one-sided t-critical value for the test is 1.753.
Example 2. Left-Tailed Test
For a left-tailed t test, use the same one-tailed table value, follow the steps in Example 1, and add a negative sign to the results. For example, if we were interested in finding the left-sided t-critical value for Example 1, we would take 1.753 and add a negative sign. Therefore, the left-sided t-critical value would be -1.753
Example 3. Two-Tailed Test
A researcher wants to test whether the average AP Statistics exam score of students in a school is different from the national average of 78. A sample of n = 21 students is selected. Find the critical value for a two-tailed test at α = 0.05.
Solution
To find the correct t-critical values for this test, follow these steps:
Step 1. Identify the correct table
From the question, the researcher wants to determine whether the average AP Statistics exam score is different from 78. In other words, we want to test the hypotheses:
H₀: μ = 78
H₁: μ ≠ 78
The not-equal-to sign in the alternative hypothesis shows that the difference could occur in either direction. Therefore, this is a two-tailed test, and we should use the two-sided t-distribution table.
Step 2. Identify the degrees of freedom and significance level
From the question, the significance level, α = 0.05
Since this is a one-sample t-test, the degrees of freedom formula is: df = n − 1, where n is the sample size.
Therefore: df = 21 − 1
= 20
Step 3. Using a two-sided table, find the value where the α column meets the df row
From the two-sided t-distribution table, locate the α = 0.05 column and the df = 20 row.
The column and row meet at 2.086
Because this is a two-tailed test, the rejection regions are located in both tails of the t distribution. Therefore, one critical value is negative, and the other is positive.
Therefore, the two-tailed t-critical values are: −2.086 and 2.086. This can also be written as ±2.086
Using statistical notation, t0.05/2, 20 = ±2.086 (see the figure below)
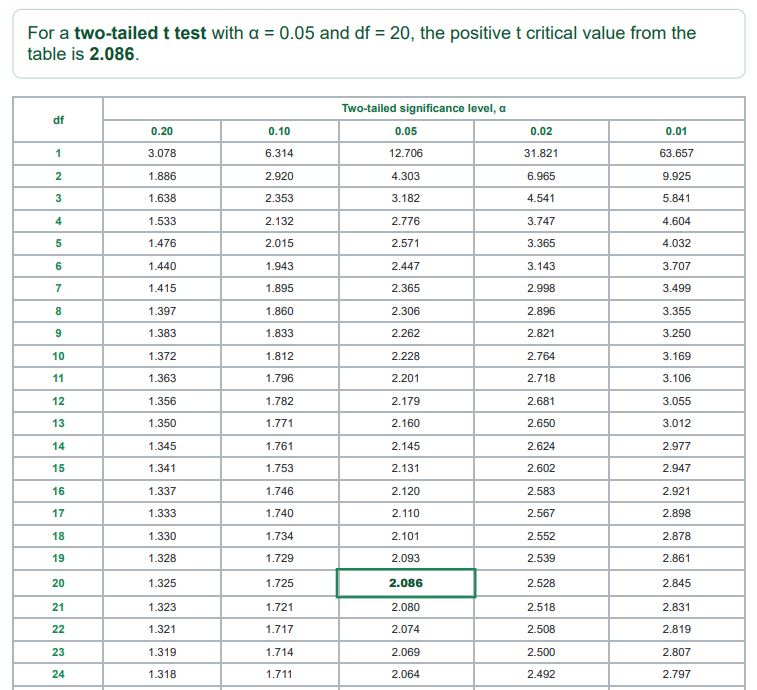
Alternatively, you can use our interactive t-distribution table to quickly find the same value. Follow these simple steps:
- Select two-sided.
- Select α = 0.05 and df = 20.
- Click the “Find Critical Value” button.
The table will automatically move to the point where the α = 0.05 column and the df = 20 row meet. In this case, the two-sided table value is 2.086.
Want to quickly find the t-critical value for any df and significance level (α)? Use the t critical value calculator instead.
T Distribution Table PDF Version
Want to use the t-tables manually? You can also download the PDF format for each table as follows:
- For a two-sided table PDF download, select two-tailed as the tail type and click the “Print/Save as PDF” button
- However, for a one-sided PDF download, select one-tailed as the tail type and click the “Print/Save as PDF” button
