
F Distribution Table (F Table)
What Is an F Distribution Table?
An F distribution table, also called an F table or F critical value table, is a statistical table used to find critical values from the F distribution.
It is also called an F critical value table because the values in the table act as cutoff points when performing F tests such as ANOVA, overall regression significance tests, and tests involving ratios of variances.
To find an F critical value from the table, you need three values:
- the significance level, α
- the numerator degrees of freedom, df₁
- the denominator degrees of freedom, df₂
The F tables on this page give upper-tail critical values. This is appropriate for common F tests such as ANOVA and the overall F test in regression, where large F statistics provide evidence against the null hypothesis.
For a right-tailed F test, the usual decision rule is:
- F statistic > F critical → Reject H₀
- F statistic ≤ F critical → Fail to reject H₀
However, some tests involving ratios of variances can be left-tailed or two-tailed. You can still use an upper-tail F table for these tests by applying the procedures explained later on this page.
How to Use This F Table
The interactive F table above allows you to find F critical values without searching through several separate printed tables. It includes the commonly used significance levels α = 0.10, 0.05, 0.025, 0.01, and 0.005.
To use the table:
- Select the required significance level, α.
- Find the numerator degrees of freedom, df₁, across the top of the table.
- Find the denominator degrees of freedom, df₂, down the left side.
- Locate the value where the df₁ column and df₂ row meet.
- Hover over the value to highlight its row and column, or click it to select the critical value and view its position on the F distribution.
The heading above the table also updates to show the significance level you have selected.
Example 1: Find an F Critical Value Using the Interactive Table
An ANOVA test has the following values:
- Significance level, α = 0.01
- Numerator degrees of freedom, df₁ = 2
- Denominator degrees of freedom, df₂ = 12
Find the F critical value.
Solution
To find the F critical value for the test using the above table, you need to select the F table for α = 0.01 and follow these steps:
- Find df₁ = 2 across the top.
- Find df₂ = 12 down the left side.
- Locate the value where the column and row meet. They meet at 6.927.
Therefore, F₀.₀₁(2, 12) = 6.927 (See the figure below). If the calculated F statistic is greater than 6.927, reject the null hypothesis and conclude that the result is statistically significant at the 0.01 significance level.

How to Read an F Table Manually
All of the F tables on this page follow the same layout. The numerator degrees of freedom, df₁, appear across the top of the table, while the denominator degrees of freedom, df₂, appear down the left side.
You must also make sure that you are using the table for the correct significance level.
To read an F table manually:
- Choose the F table that matches the significance level, α.
- Find the numerator degrees of freedom, df₁, across the top.
- Find the denominator degrees of freedom, df₂, down the left side.
- Read the value where the df₁ column and df₂ row meet.
If you have not yet calculated the degrees of freedom for your test, use our Degrees of Freedom Calculator.
Example 2: Find an F Critical Value Manually
Suppose a statistics problem gives:
- α = 0.05
- df₁ = 3
- df₂ = 16
Find the critical F value.
Solution
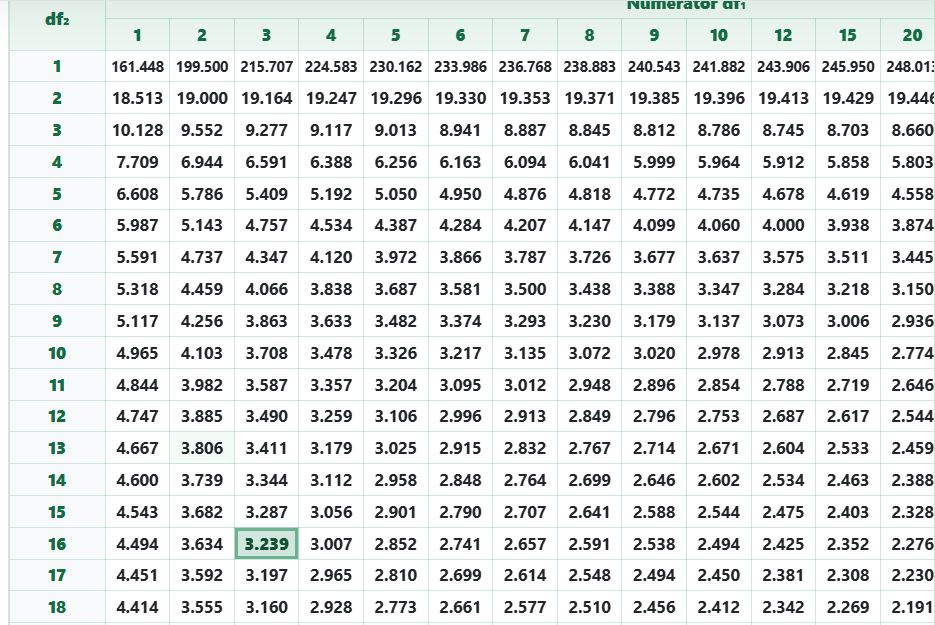
Since α = 0.05, use the F table for α = 0.05.
Next:
- Move across the top to df₁ = 3.
- Move down the left side to df₂ = 16.
- Find the value where the row and column meet. The table gives: F critical = 3.239, as shown below.
Therefore, F0.05, 3, 16 = 3.239. For a right-tailed test, reject the null hypothesis if the calculated F statistic is greater than 3.239.
How to Find Right-Tailed, Left-Tailed, and Two-Tailed F Critical Values
Most printed F tables give only upper-tail critical values because the most common F tests, including ANOVA and overall regression F tests, use a right-tailed rejection region. However, the F distribution can also be used in left-tailed and two-tailed tests involving variances.
The method you use depends on the alternative hypothesis.
Right-Tailed F Critical Value
For a right-tailed test, use the significance level α directly.
Suppose:
- α = 0.05
- df₁ = 5
- df₂ = 10
Using the F table for α = 0.05, locate df₁ = 5 across the top and df₂ = 10 down the side. The table gives: F critical = 3.326
Therefore, the rejection region is F > 3.326. This is the usual procedure for ANOVA and regression F tests.
Left-Tailed F Critical Value
The tables on this page do not list lower-tail critical values directly. However, you can obtain the lower critical value using the reciprocal property of the F distribution.
To find a left-tail critical value:
- Swap df₁ and df₂.
- Find the upper-tail F critical value using the same α.
- Take the reciprocal of that value.
In other words, F lower = 1 / Fα(df₂, df₁)
For example, suppose α = 0.05, df₁ = 5, and df₂ = 10. We can find the left-tailed F-critical value as follows:
- Swap the degrees of freedom
- Find F₀.₀₅(10, 5). This gives 4.735
- Take the reciprocal of the F-critical value. Thus, the left-tailed F-critical value is: F lower = 1 / 4.735 = 0.211
Therefore, the left-tail critical value is approximately 0.211. The rejection region is F < 0.211.
Notice that you must swap the numerator and denominator degrees of freedom before taking the reciprocal.
Two-Tailed F Critical Values
For a two-tailed F test, the significance level is divided equally between the two tails. Therefore, Tail area = α / 2.
After dividing the significance level by two, use the same approach described above to find the right-tailed and left-tailed F critical values. In particular, use α/2 directly to look up the critical value from the F-table for a right-tailed critical value. However, for the left-tailed critical value, swap df₁ and df₂, find the upper-tail critical value using α/2, and then take its reciprocal.
For example, if α = 0.05, then α / 2 = 0.025. Therefore, we should use the F table for α = 0.025 to find both critical values.
Suppose:
- α = 0.05
- df₁ = 5
- df₂ = 10
For the upper critical value, use the α = 0.025 table and find: F upper = F₀.₀₂₅(5, 10), which gives 4.236
However, for the lower critical value, swap the degrees of freedom and take the reciprocal. Thus, F lower = 1 / F₀.₀₂₅(10, 5). From the table, F₀.₀₂₅(10, 5) = 6.619. Therefore, F lower = 1 / 6.619 = 0.151.
As such, the two rejection regions are approximately: F < 0.151 or F > 4.236. This procedure is commonly used when a variance-ratio test is two-sided.
Why the F Table Uses the Right Tail
The F distribution is not symmetric like the normal distribution. It starts at zero and is typically skewed to the right.
For common F-tests such as ANOVA, large F-statistics provide evidence against the null hypothesis. Therefore, the rejection region is placed in the right tail of the F distribution.
The F critical value marks the point where the right-tail rejection region begins. The area to the right of this critical value is equal to the significance level, α.
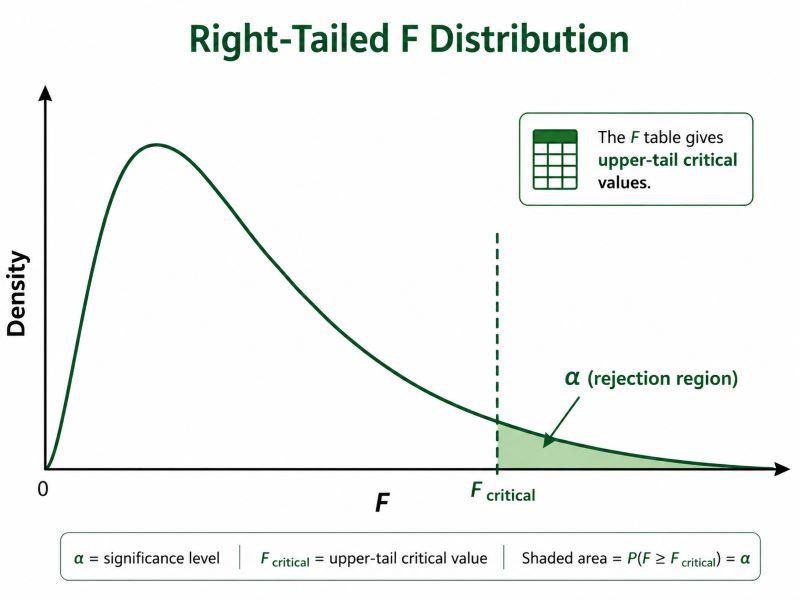
For a right-tailed F-test:
- F-statistic > F critical → Reject H₀
- F-statistic ≤ F critical → Fail to reject H₀
If the F-statistic is greater than the critical value, it falls in the rejection region, and the result is statistically significant.
Note: Some procedures involving ratios of variances can be two-tailed. The tables on this page provide upper-tail F critical values. Always follow the decision rule specified for the particular test you are performing.
How to Find df₁ and df₂
An F distribution has two degrees of freedom because the F statistic is based on a ratio of two variance-related quantities. The first is the numerator degrees of freedom, df₁, and the second is the denominator degrees of freedom, df₂.
The formulas depend on the statistical test being performed. The table below provides degrees of freedom formulas for most common F-tests.
| Test | Numerator df₁ | Denominator df₂ |
|---|---|---|
| One-way ANOVA | k − 1 | N − k |
| Overall regression F test | p | N − p − 1 |
| Two-sample variance F test | n₁ − 1 | n₂ − 1 |
Where:
- k is the number of groups.
- N is the total sample size.
- p is the number of predictors in the regression model.
- n₁ and n₂ are the sample sizes used in the variance test.
Tip. For other F tests not listed in the above table, use the degrees of freedom specified by the test. Always keep df₁ and df₂ in the correct order. Reversing them can give a different F critical value.
F Distribution Tables by Significance Level
Each F distribution table corresponds to a specific significance level. Before looking up a critical value, make sure you are using the table that matches the α given in your problem.
In each table:
- df₁, the numerator degrees of freedom, appears across the top.
- df₂, the denominator degrees of freedom, appears down the left side.
- The value where the df₁ column and df₂ row meet is the F critical value.
F Table 0.10
The F table 0.10 gives upper-tail F critical values for a significance level of α = 0.10. Use this table when your problem specifies a 10% significance level. Locate df₁ across the top and df₂ down the left side, then read the critical value where the two meet.

F Table 0.05
The F table 0.05 gives upper-tail F critical values for α = 0.05. This is one of the most commonly used F tables because many hypothesis tests use a 5% significance level. For instance, for an ANOVA performed at α = 0.05, use this table together with the given df₁ and df₂ to find the cutoff for statistical significance.

F Table 0.025
The F table 0.025 gives upper-tail F critical values for α = 0.025. Use this table whenever your problem specifies an upper-tail probability of 0.025. This significance level can also appear in procedures where an overall α = 0.05 is divided between two tails.

F Table 0.01
The F table 0.01 gives upper-tail F critical values for a significance level of α = 0.01. Use this table when you want to perform an F-test at the 1% significance level. For the same df₁ and df₂, an F critical value for α = 0.01 will generally be larger than the corresponding critical value for α = 0.05 because a smaller area is placed in the right tail.

F Table 0.005
The F table 0.005 gives upper-tail F critical values for α = 0.005. Use this table whenever your problem specifies an upper-tail significance level of 0.005. Because the rejection region contains only 0.5% of the distribution, the corresponding critical values are generally larger than those for more common alpha levels such as 0.05.

When to Use an F Table
Use an F table when a statistical test produces a test statistic that follows an F distribution, and you need to determine the corresponding critical value.
Common examples include:
- ANOVA tests for differences among group means
- overall F-tests for regression models
- tests involving ratios of variances
- textbook or exam problems that specifically ask you to use an F table
For common right-tailed F-tests, you compare the calculated F-statistic with the critical value from the appropriate table.
F Table or F Critical Value Calculator?
An F table is useful when you are learning how critical values are found, completing an exam or homework problem that specifically requires a statistical table, or checking a critical value manually.
However, traditional F tables only contain selected significance levels and degrees of freedom.
If the exact significance level or degrees of freedom you need are not shown in the table, use the F critical value calculator. It calculates the F critical value directly without requiring you to choose the nearest value from a printed table.
The interactive F table above gives you both options. You can see how an F distribution table is organized and still find the required critical value automatically.
Frequently Asked Questions
An F table is a statistical table used to find F critical values based on alpha level, numerator degrees of freedom, and denominator degrees of freedom.
Choose the alpha level first. Then find the numerator degrees of freedom across the top and the denominator degrees of freedom down the side. The value where the row and column meet is the F critical value.
This F table includes common significance level values you’ll come across in your coursework. These include α = 0.10, 0.05, 0.025, 0.01, and 0.005.
This table shows upper-tail, or right-tail, F critical values. These are the values most commonly used in ANOVA, regression F tests, and F tests comparing variances.
Use the closest value required by your course. Alternatively, you can use the F critical value calculator for a more exact result.
