
r Critical Value Table for Pearson Correlation
What Is an r Critical Value Table?
An r critical value table, also known as a correlation critical value table, is a statistical table that provides cutoff values used to determine whether a Pearson correlation coefficient is statistically significant. We com
In this case, we compare the calculated Pearson’s correlation coefficient (r) with the r-critical value from the table and make decisions as follows:
- Reject the null hypothesis (H0) if the absolute value of the correlation coefficient |r| is greater than or equal to the absolute r-critical value. This implies that the linear relationship is statistically significant.
- Fail to reject the null hypothesis (H0) if the absolute value of the correlation coefficient |r| is less than the r-critical value. This implies that the linear relationship is not statistically significant.
How to Use This Interactive Correlation Critical Value Table
This interactive correlation critical value table makes it easy for you to look up the correct critical value within a few clicks. To use the table:
- Select whether you are conducting a one-tailed or two-tailed test. Most correlation tests are two-tailed unless otherwise stated.
- Select the significance level from the dropdown and enter the correct degrees of freedom (df)
- Click the “Find Critical Value” button
The table will instantly highlight the correct r critical value for your test.
Recall. Use a one-tailed test when your hypothesis predicts a specific direction of the linear relationship.
How to Read the r Critical Value Table
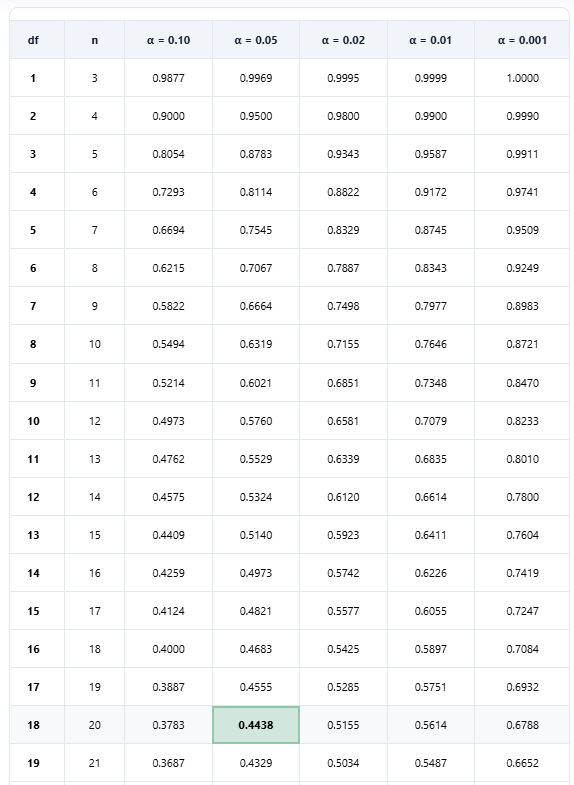
The r-critical value table lists df on the rows and significance level (α) on the columns. Therefore, to read the correct correlation critical value for your test:
- Identify the tail of the test. Most correlation tests are two-tailed unless otherwise stated.
- Identify the significance level (α)
- Compute the degrees of freedom (df)
- Find the value where the α column meets the df row. This is the r critical value.
Example
Suppose you have a sample of 20 paired observations and are conducting a two-tailed test at α = 0.05 to determine whether the number of hours spent studying is correlated with the final exam score. Find the r critical value using tables.
Solution
To find the correlation critical value using the table, follow these steps:
Step 1. Identify the test type
Since the aim is to determine whether the linear relationship is statistically significant regardless of the direction, this is a two-tailed test. Therefore, we should use a two-tailed r-critical value table.
Step 2. Identify the significance level
From the question, α = 0.05
Step 3. Compute the degrees of freedom
By definition, the degrees of freedom formula for Pearson’s correlation test is: df = n-2, where n is the number of paired observations.
Since there are 20 pairs, df = 20-2
= 18
Want a quick way to calculate the correct degrees of freedom for your Pearson’s correlation test? Use the degrees of freedom calculator.
Step 4. Find the value where the α column meets the row.
The α = 0.05 column meets the df=18 row at 0.4438. Therefore, the r critical value for the test is ±0.4438.
Want a quick way to find the correlation critical value without using tables? Use the r critical value calculator instead.
Frequently Asked Questions
An r critical value table lists the minimum Pearson correlation coefficient required for statistical significance at a given significance level and number of degrees of freedom. You compare your calculated correlation coefficient with the table value to determine whether the correlation is statistically significant.
First, calculate the degrees of freedom using df = n − 2, where n is the number of paired observations. Next, choose the significance level and whether the test is one-tailed or two-tailed. The value at the intersection of the selected degrees of freedom and significance level is the critical value of r.
Use a two-tailed table when testing whether a correlation exists in either direction (this is the most common choice). However, if the alternative hypothesis specifies a direction before the data are analyzed, such as testing specifically for a positive or negative correlation, use a one-tailed table (left- or right-tailed).
This table is designed for Pearson’s correlation coefficient and should not normally be used as an exact critical value table for Spearman’s rank correlation. Spearman correlation has its own critical values, especially for small samples