
How to Use the One-Sample Z-Test Calculator
This calculator helps you conduct a one-sample z-test either using summary or raw data. Therefore, if you only have the summary statistics data and want to quickly perform the one-sample z-test, follow these steps:
- Select the alternative hypothesis (H1) and enter the hypothesized population mean (μ0)
- Select the Summary Data Option
- Enter summary data values (the sample mean (x̄) and Sample size (n))
- Enter the known population standard deviation (σ) and the significance level (α)
- Click calculate
However, if you have the raw sample data and a known population standard deviation (σ), follow these steps:
- Select the alternative hypothesis (H1) and enter the hypothesized population mean (μ0)
- Select the Raw Data Option
- Enter the raw data values. You can copy and paste values directly from Excel, Google Sheets, or text documents. The raw data input field also accepts values separated using commas, spaces, tabs, or line breaks.
- Enter the known population standard deviation (σ) and the significance level (α)
- Click calculate
In each case, the calculator will instantly return the z-test statistic, p-value, and z-critical value for your test. It will also provide a clear, step-by-step solution that shows you how to apply the 6 steps of hypothesis testing.
What Is a One-Sample Z-Test?
A one-sample z test is a hypothesis test used to compare a sample mean with a hypothesized population mean when the population standard deviation (σ) is known.
In summary, you should only use a one-sample z-test if the following conditions are met:
- Population standard deviation (σ) is known
- Large sample size (n > 30). In this case, the Central Limit Theorem ensures the sampling distribution is normal, even if the underlying population is not.
- The data are normally distributed, and the population standard deviation is known. This means that you can still use a one-sample z-test even for smaller sample sizes (n ≤ 30) as long as the underlying population is strictly normally distributed with a known population standard deviation.
However, if the population standard deviation is unknown, use the one-sample t-test calculator instead.
One-Sample Z-Test Formula
The one-sample z-test statistic formula is:
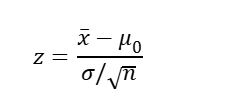
Where:
- x̄ is the sample mean
- μ₀ is the hypothesized population mean
- σ is the known population standard deviation
- n is the sample size
The denominator, σ / √n, is called the standard error. It measures how much the sample mean is expected to vary from sample to sample. To quickly find this value, you can use the standard error calculator.
How to do a One-Sample z-test
To perform a one-sample z-test manually, follow the 6 steps of hypothesis testing, which include:
- State the hypothesis
- State the significance level
- Compute the test statistic
- Find the p-value/critical value
- Make Decision
- State the conclusion
Example
Scenario: An energy drink company claims its bottles have an average volume of 500 ml. Historical data shows the population standard deviation is σ = 5 ml. You suspect the true average is different. You randomly sample 36 bottles and find a sample mean of x̄ = 498 ml. Is the company’s claim correct at a 5% significance level (α = 0.05)?
Solution
Since the population standard deviation is known and we want to test whether the sample mean is different from the claimed population mean, the appropriate test is a one-sample z-test.
To perform the test by hand, follow these steps:
Step 1: State the hypotheses
We want to test whether the average volume is different from 500 ml. Thus, this is a two-tailed test.
The correct hypotheses for the test are:
H₀: μ = 500
H₁: μ ≠ 500
Step 2: State the significance level
From the question, the significance level is α = 0.05
Step 3: Calculate the test statistic
By definition, the one-sample z-test statistic formula is: z = (x̄-μ₀)/(σ/√n)
From the question, we know that:
- x̄ = 498
- μ₀ = 500
- σ = 5
- n = 36
Substituting the values into the formula, we have:
z = (498-500)/(5/√36)
= -2/0.8333
= -2.40
Thus, the test statistic is: z = -2.40
Step 4: Find the p-value and critical value
Using the z to p-value calculator, the p-value for the two-tailed test with z = -2.40 is 0.016395. Additionally, the two-tailed critical values for the test using the z-critical value calculator are ±1.96.
Step 5: Make the decision
We can now use the p-value and the critical values to make the right decision as follows:
- Since the p-value (0.016395) is less than the 0.05 significance level, we reject the null hypothesis.
- Similarly, since the absolute test statistic value (2.40) is greater than the absolute critical value (1.96), we reject the null hypothesis.
Step 6: Write the conclusion
At the 5% level of significance, there is sufficient statistical evidence to reject the company’s claim. As such, the average volume of the energy drinks is significantly different from 500 ml.
Frequently Asked Questions
This calculator performs a one-sample z-test for a population mean. It returns the z statistic, p-value, critical value, and a step-by-step hypothesis test solution.
Use a one-sample z-test when you want to compare a sample mean with a hypothesized population mean and the population standard deviation is known.
Yes. The calculator allows you to enter raw data values. It will automatically calculate the sample mean and sample size from your data.
Yes. Raw data mode still requires the known population standard deviation, σ. If σ is unknown, use a one-sample t-test instead.
A one-sample z-test is used when the population standard deviation is known, whereas a one-sample t-test is used when the population standard deviation is unknown, and the sample standard deviation is used instead.
