
Want to instantly compute the pooled standard deviation and see the steps? Use the pooled standard deviation calculator instead.
How to Use the Pooled Variance Calculator
This calculator instantly computes the pooled variance for two independent groups from a given raw data or summary data. To use the calculator:
- Choose the Raw Data option or Summary Data option and enter the data
- Click Calculate
The calculator will instantly return the pooled variance and show you exactly how to compute it manually, with a step-by-step explanation.
Tips.
- Use the Raw Data Option if you have actual values for each group. In this case, you can paste values directly from Excel, Google Sheets, or text documents. The calculator also accepts values separated by commas, spaces, tabs, or line breaks.
- Use the Summary Data Option if you only know summary statistics values such as n₁, s₁², n₂, and s₂²
What Is Pooled Variance?
Pooled variance is a weighted average of sample variances from two independent groups. It provides a single and highly precise estimate of the combined population variance for these independent groups. You’ll come across pooled variance when conducting an independent samples t-test, assuming the equality of variance assumption.
Pooled Variance Formula
As noted in the definition, the pooled variance is common when conducting the independent samples t-test. In this case, the pooled variance formula for these two independent groups is:
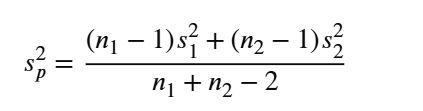
Where:
- sₚ² is the pooled variance.
- n₁ is the sample size of group 1.
- n₂ is the sample size of group 2.
- s₁² is the sample variance of group 1.
- s₂² is the sample variance of group 2.
- n₁ − 1 and n₂ − 1 are the degrees of freedom for the two groups.
The formula is called the weighted average of the two sample variances because it uses the degrees of freedom for each group (n1-1 and n2-1) as the weights when finding the pooled variance.
How to Calculate Pooled Variance
To calculate pooled variance manually:
- Find the sample size and sample variance for each group.
- Subtract 1 from each sample size to get the degrees of freedom.
- Find the total degrees of freedom
- Substitute the values into the pooled variance formula and solve
Example 1. Pooled Variance for Summary Data
A researcher compares the scores of two independent groups. The summary statistics are:
- Group 1: n₁ = 16, s₁² = 9.5
- Group 2: n₂ = 20, s₂² = 12.4
Find the pooled variance.
Solution
To find the pooled variance for the above summary data, follow these steps:
Step 1: Find the sample size and sample variance for each group
In this case, we already have these values. In particular, we already know that:
- Sample size for Group 1, n₁ = 16
- Sample variance for Group 1, s₁² = 9.5
- Sample size for Group 2, n₂ = 20
- Sample variance for Group 2, s₂² = 12.4
Step 2: Subtract 1 from each sample size to get the degrees of freedom.
Subtracting 1 from the sample size of each group, we get the following degrees of freedom
- df1 = n1-1 = 16-1 = 15
- df2 = n2-1 = 20-1 = 19
Step 3: Find the total degrees of freedom
For two independent groups, assuming equal population variance, the total degrees of freedom is: n1+n2-2
= 16 + 20 – 2
= 34
Step 4: Substitute the values into the pooled variance formula and solve
By definition, the pooled variance formula is: sₚ² = [((n₁ − 1)s₁²) + ((n₂ − 1)s₂²)] / (n₁ + n₂ − 2)
Substituting the values and solving, we get: sₚ² = [((15)(9.5)) + ((19)(12.4))] / 34
= [142.5 + 235.6] / 34
= 378.1 / 34
Hence, sₚ² = 11.120588
You can also confirm the result using the pooled variance calculator and following these simple steps:
- Choose the Summary Data Option
- Enter n₁ = 16, s₁² = 9.5, n₂ = 20, and s₂² = 12.4
- Click Calculate
The calculator will instantly return the pooled variance, sₚ² = 11.120588.
Example 2. Pooled Variance for Raw Data
If you want to find the pooled variance manually using raw data, the steps are the same. You only need to first compute the sample variance for each group using the sample variance calculator and substitute those values into the formula. However, with the pooled variance calculator, just select the raw data option, enter the raw values, and click calculate. The calculator will automatically compute these sample variances behind the scenes and apply the pooled variance formula to get the result.
When to Use Pooled Variance?
Use pooled variance when you are working with two independent groups, and it is reasonable to assume that the two population variances are equal. The most common areas where pooled variance is applied include:
- Independent two-sample t-tests that assume equal variances
- Equal-variance hypothesis tests
- Comparing two independent group means
- Estimating a common variance from two samples
Frequently Asked Questions
This calculator finds the pooled variance for two independent groups. To use the calculator, select either the Raw Data option or Summary Data option, enter the values, and click calculate. You’ll get instant results with a clear, step-by-step solution.
Pooled variance is a combined estimate of variance from two independent groups, usually used when the two groups are assumed to have equal population variances.
The pooled variance formula is: sₚ² = [((n₁ − 1)s₁²) + ((n₂ − 1)s₂²)] / (n₁ + n₂ − 2), where n₁ and n₂ are sample sizes, and s₁² and s₂² are sample variances.
Yes. Choose the Raw Data option and enter the values for Group 1 and Group 2. The calculator will find each group’s sample variance first, then calculate the pooled variance.
No. The pooled variance is the square of the pooled standard deviation.
