
Want to find the pooled variance and see the steps? Use the pooled variance calculator instead.
How to Use the Pooled Standard Deviation Calculator
This calculator helps you find the pooled standard deviation for two independent groups. You can use the result when performing an independent-samples t-test, assuming the homogeneity of variance assumption is met. To find the pooled standard deviation using this calculator:
- Select the Raw Data option or Summary Data option
- For raw data, you can enter values for each of the two independent groups in the data input fields. The calculator accepts data separated using commas, spaces, tabs, or line breaks. You can also copy-paste values directly from Excel, Google Sheets, or text documents
- However, if you have summary statistics data (n1, s1, n2, s2), switch to the summary data option and enter the values
- Click Calculate
The calculator will instantly return the correct pooled standard deviation for your data. Want to learn how the value was calculated? View the step-by-step solution to learn how the pooled standard deviation was computed using your own data.
Still don’t know how to find the standard deviation for your sample? Use the standard deviation calculator to get instant results and see the manual steps.
What Is Pooled Standard Deviation?
The pooled standard deviation is a single estimate of standard deviation obtained by combining the variability from two independent groups. It is mainly used when conducting an independent t-test, when the two groups under investigation are assumed to have the same population variance. Therefore, instead of treating the standard deviation of each group separately, we use the weighted estimate.
Therefore, the word “pooled” means combining information from both groups, while ensuring larger samples contribute more to the final results.
Pooled Standard Deviation Formula
For two independent groups, the pooled standard deviation formula is:
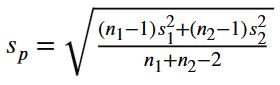
Where:
- sₚ is the pooled standard deviation.
- n₁ is the sample size of group 1.
- n₂ is the sample size of group 2.
- s₁ is the sample standard deviation of group 1.
- s₂ is the sample standard deviation of group 2.
- n₁ − 1 and n₂ − 1 are the degrees of freedom for the two groups.
The formula works by finding a weighted average of the two sample variances, then taking the square root of the result.
How to Calculate Pooled Standard Deviation
To calculate pooled standard deviation manually:
- Find the sample size and sample standard deviation for each group.
- Apply the pooled standard deviation formula
Example 1. Summary Data
A researcher compares test scores from two independent classes. The summary statistics are:
- Group 1: n₁ = 18, s₁ = 4.2
- Group 2: n₂ = 14, s₂ = 5.1
Find the pooled standard deviation.
Solution
To find the pooled standard deviation for the above data manually, follow these steps:
Step 1: Identify the given summary statistics.
From the question, we know that:
- The sample size for group 1, n₁ = 18
- The sample standard deviation for group 1, s₁ = 4.2
- The sample size for group 2, n₂ = 14
- The sample standard deviation for group 2, s₂ = 5.1
Step 2: Write the pooled standard deviation formula.
By definition, the pooled standard deviation formula is: sₚ = √[((n₁ − 1)s₁² + (n₂ − 1)s₂²) / (n₁ + n₂ − 2)]
Step 3: Substitute the values into the formula and solve.
Substituting the values into the formula and solving, we get
sₚ = √[((18 − 1)(4.2)² + (14 − 1)(5.1)²) / (18 + 14 − 2)]
= √[(17(17.64) + 13(26.01)) / 30]
= √[(299.88 + 338.13) / 30]
Summing the numerator and dividing by 30, we get:
sₚ = √21.267
= 4.611616
Therefore, the pooled standard deviation for the data is sₚ = 4.611616.
You can also confirm this result using the calculator by following these steps:
- Switch to the Summary Data Option
- Enter n₁ = 18, s₁ = 4.2, n₂ = 14, and s₂ = 5.1 in the data input field
- Click calculate
The calculator returns the pooled standard deviation, sₚ = 4.611616.
Example 2. Raw Data
A researcher records scores from two independent groups:
- Group 1: 22, 24, 25, 27, 30
- Group 2: 19, 21, 22, 25, 26, 28
Find the pooled standard deviation.
Solution
To find the pooled standard deviation for the above data by hand, follow these steps:
Step 1: Find the sample sizes and sample standard deviations for Group 1 and Group 2
From the given data:
- There are 5 observations in Group 1 and 6 observations in Group 2. Hence, n1 = 5 and n₂ = 6
To find the sample standard deviations for these Groups, use the sample standard deviation calculator, enter the data, and click calculate.
- The sample standard deviation for Group 1 is s₁ = 3.04959.
- The sample standard deviation for Group 2 is s₂ = 3.391165.
Step 2: Apply the pooled standard deviation formula and solve
By definition, the pooled standard deviation formula is: sₚ = √[((n₁ − 1)s₁² + (n₂ − 1)s₂²) / (n₁ + n₂ − 2)]
Substituting the values into the formula and solving, we get:
sₚ = √[((5 − 1)(3.049590)² + (6 − 1)(3.391165)²) / (5 + 6 − 2)]
= √[(4(9.3) + 5(11.5)) / 9]
= √[(37.2 + 57.5) / 9]
Adding the numerator and dividing the result by the denominator, we have:
sₚ= √10.522222
= 3.243798
Therefore, the pooled standard deviation is: sₚ = 3.243798
However, using the pooled standard deviation calculator, the process is simple and straightforward. Just follow these steps:
- Select the Raw Data option
- Enter Group 1 data in the Group 1 data input field and Group 2 data in the Group 2 data input field
- Click Calculate
The calculator will yield a similar result as above.
When to Use Pooled Standard Deviation?
Use pooled standard deviation when you want to combine the spread of two independent groups, and it is reasonable to assume that both groups have the same population variance.
It is commonly used in:
- Independent two-sample t-tests that assume equal variances
- Cohen’s d effect size calculations
- Comparing two independent group means
- Combining variability estimates from two similar groups
- Introductory statistics problems involving equal-variance assumptions
Frequently Asked Questions
It calculates the pooled standard deviation for two independent groups. Just enter raw data values or summary statistics and click calculate to get instant results with a clear, step-by-step explanation.
Pooled standard deviation is a combined estimate of standard deviation from two independent groups, usually used when the two groups are assumed to have equal population variances.
The formula is: sₚ = √[((n₁ − 1)s₁² + (n₂ − 1)s₂²) / (n₁ + n₂ − 2)], where n₁ and n₂ are the sample sizes, and s₁ and s₂ are the sample standard deviations.
No. Pooled standard deviation is not the simple average of two standard deviations. It combines sample variances using degrees of freedom.
No. Pooled standard deviation is for independent groups. Paired data should be analyzed using the differences between paired observations.
Pooled variance is the weighted average of the group variances. Pooled standard deviation is the square root of pooled variance.
