
How to Use the Two Sample Z Test Calculator
This two sample z test calculator will help you test whether there is a statistically significant difference between the means of two independent populations when both population standard deviations are known. The calculator accepts raw data and summary statistics data.
To use the calculator:
- Select the alternative hypothesis that matches your research question.
- Enter the significance level, α.
- Choose Summary Data or Raw Data.
- Enter the required information for Sample 1 and Sample 2.
- Click Calculate.
The calculator will instantly return the z statistic, p-value, and critical value. It will also provide a complete six-step hypothesis test solution showing how the result was calculated and interpreted.
Tips.
- Select the Summary Data option when you already know the sample mean for both groups, population standard deviation for both groups, and sample sizes for both groups
- Use the Raw Data option when you have the individual observations for both groups and the population standard deviations for both groups are known. In this case, enter the values for each sample separated by commas, spaces, tabs, or line breaks. You can also copy and paste values directly from Excel, Google Sheets, or a text document.
What Is a Two Sample Z Test?
A two sample z test is a hypothesis test used to determine whether the means of two independent populations differ significantly when the population standard deviations are known.
The test compares the observed difference between the two sample means with the difference expected under the null hypothesis. In most applications, the null hypothesis states that the population means are equal: H₀: μ₁ − μ₂ = 0
The test then standardizes the observed mean difference using the standard error based on σ₁, σ₂, n₁, and n₂.
A two sample z test is also called a:
- Two-sample z test for means
- Independent samples z test
- Two population means z test
- Z test for the difference between two means
Note. The two samples must be independent and the population standard deviations should be known. However, if the two samples are independent and the population standard deviations are unknown, the two sample t test is the most appropriate.
Working with related samples? Use the paired t-test instead.
Two Sample Z Test Assumptions
The two sample z-test is only appropriate if the following assumptions are met:
- The two samples must be independent.
- Observations within each sample should be independent
- The sample should be randomly selected from the target population
- The should be one dependent variable measured on a continuous scale
- The sampling distribution of the mean difference should be approximately normally distributed
- The population variance (standard deviation) should be known
Hypotheses for a Two Sample Z Test
In a two sample z test, we want to test the null hypothesis: H0: μ1 = μ2 versus either of the following alternative hypotheses:
- H1: μ1 ≠ μ2 for a two-tailed test
- H1: μ1 > μ2 for a right-tailed test
- H1: μ1 < μ2 for a left-tailed test
Two Sample Z Test Formula
The test statistic formula for a two sample z test is:
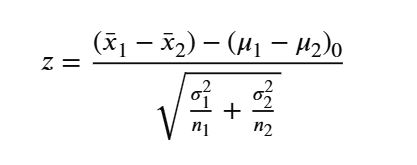
Where:
- z is the two sample z-test statistic
- x̄₁ is the mean of Sample 1
- x̄₂ is the mean of Sample 2
- σ₁ is the known standard deviation of Population 1
- σ₂ is the known standard deviation of Population 2
- n₁ is the size of Sample 1
- n₂ is the size of Sample 2
- (μ₁ − μ₂)₀ is the population mean difference specified by the null hypothesis. This is usually zero in most cases
When the null hypothesis states that the two population means are equal, the (μ₁ − μ₂)₀ = 0. This simplifies the test statistic formula to:
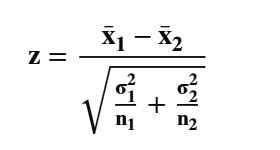
Note. The denomination is the standard error of the difference between the two sample means.
How to Perform a Two Sample Z Test
A complete two sample z test follows six steps:
- State the null and alternative hypotheses.
- State the significance level.
- Calculate the z statistic.
- Find the p-value and critical value.
- Make the statistical decision.
- Write the conclusion in the context of the question.
The following examples demonstrate the complete procedure using summary data and raw data.
Example 1. Summary Data
A manufacturing facility operates two independent production lines to assemble consumer electronics. The plant manager wants to evaluate whether a significant difference exists in the true population mean hourly output between these two lines. Historical process tracking records indicate that the population standard deviations for both lines are stable and well-known.
To conduct this analysis, an industrial engineer collects a random sample of hourly data from each line.
- A sample of 50 operating hours from Line 1 reveals a sample mean hourly output of 102.4 units, with a known population standard deviation of 6.0 units.
- A sample of 45 operating hours from Line 2 shows a sample mean hourly output of 98.7 units, with a known population standard deviation of 5.5 units.
Using a 0.05 significance level, test the claim that the population mean hourly outputs of the two production lines are different.
Solution
The two production lines represent independent groups, and both population standard deviations are known. Therefore, a two sample z test is appropriate.
To perform the test, follow these six steps of hypothesis testing:
Step 1: State the Hypotheses
The company wants to determine whether the means differ in either direction. Therefore, this is a two-tailed test.
The hypotheses are:
- H0: μ1 − μ2 = 0
- H1: μ1 − μ2 ≠ 0
Step 2: State the Significance Level
The question specifies a 0.05 significance level. Therefore, α = 0.05
Step 3: Calculate the Z Statistic
By definition, the two sample z-statistic formula is: z = (x̄₁ − x̄₂) / √(σ₁²/n₁ + σ₂²/n₂)
From the question, we know that:
- Sample mean of group 1, x̄₁ = 102.4
- Sample mean of Group 2, x̄₂ = 98.7
- Population standard deviation of Group 1, σ1 =6.0
- Sample size of Group 1, n₁ = 50
- Population standard deviation of Group 2, σ2 = 5.5
- Sample size of Group 2, n₂ = 45
Substituting the values into the formula, we get:
z = (102.4 − 98.7) /√(6.02/50 + 5.52/45)
= 3.7/√1.3922
=3.1358
Therefore, the test statistic is: z = 3.1358
Step 4: Find the P-Value and Critical Value
Using the p value from z calculator, the two-tailed p value is 0.001714. You can also use the z table and follow these steps to get the same results:
- Find the left-tailed probability, P(Z<3.14). To do this, find the value where 3.1 row and 0.04 meet. The values meet at 0.9992
- Subtract P(z<3.14) from 1 to get P(z>3.14). Thus, P(z>3.14) = 1-0.9992 = 0.0008
- Since this is a two-tailed test, we should multiply P(z>3.14) by 2. Thus, the two-tailed p value for the test is 2*0.0008 = 0.0016
To find the critical value for the test, you can either use a z critical value calculator or standard normal tables. Using the calculator, the two-tailed z-critical values at 5% level are ±1.9600
Step 5: Make the Decision
P-value approach: Since the p-value (0.001714) is less than the 0.05 significance level, we reject the null hypothesis
Critical value approach: Since the absolute test statistic (3.1358) is greater than the absolute critical value (1.96), we reject the null hypothesis.
Step 6: Write the Conclusion
At the 0.05 significance level, there is sufficient evidence to conclude that the two production lines have different population mean hourly outputs.
Verify Example 1 Using the Calculator
To verify the result using the two sample z test calculator, follow these steps:
- Select correct alternative hypothesis as: H₁: μ₁ − μ₂ ≠ 0.
- Enter α = 0.05.
- Select Summary Data.
- For Sample 1, enter x̄₁ = 102.4, σ₁ = 6.0, and n₁ = 50.
- For Sample 2, enter x̄₂ = 98.7, σ₂ = 5.5, and n₂ = 45.
- Click Calculate.
The calculator will instantly return:
- Z statistic: 3.1358
- P-value: 0.001714
- Critical values: ±1.9600
- Decision: Reject H₀
It will also display the complete six-step solution.
Example 2. Raw Data
An education researcher is conducting a summative evaluation to compare the effectiveness of two distinct instructional methodologies. Program 1 employs an active-learning framework and is hypothesized to yield higher examination performance than Program 2, which utilizes traditional lecture-based instruction.
At the conclusion of the academic term, independent random samples of students were selected from each instructional track, and their final examination scores were recorded:
- Program 1 (n₁ = 10): 84, 79, 88, 82, 86, 81, 90, 85, 83, 87
- Program 2 (n₂ = 10): 78, 80, 75, 82, 79, 77, 81, 76, 83, 78
Historical institutional data from large-scale state assessments indicate that the population standard deviation for Program 1 is σ₁ = 5.0, and for Program 2 is σ₂ = 4.5. Assume final examination scores are normally distributed in both populations. Using a significance level of α = 0.05, test the researcher’s claim.
Solution
The two groups contain different students, so the samples are independent. The population standard deviations are also known. Therefore, a two sample z test is appropriate.
Step 1. Hypotheses
The researcher expects Program 1 to produce a higher population mean score. Therefore, this is a right-tailed test.
The hypotheses are:
- H0: μ1 − μ2 = 0
- H1: μ1 − μ2 > 0
Step 2: Significance Level
From the question, we need to test the hypothesis at 0.05 significance level. Thus, α = 0.05
Step 3: Test Statistic
By definition, the test statistic formula for a two sample z test is: z = (x̄₁ − x̄₂) / √(σ₁²/n₁ + σ₂²/n₂)
Since have raw data, we need to compute sample means for each of the groups. Using the sample mean calculator, we get the following sample summary statistics
- Sample 1 mean, x̄₁ = 84.5
- Sample 1 size, n₁ = 10
- Sample 2 mean, x̄₂ = 78.9
- Sample 2 size, n₂ = 10
From the question, we also know that:
- Population standard deviation for Group 1 and 2 are σ₁ = 5.0 and σ₂ = 4.5 respectively.
Substituting the values into the formula, we get:
z = (84.5 − 78.9) /√(5.02/10 + 4.52/10)
=5.6/√4.525
= 2.6326
Step 4: P-Value and Critical Value
Because this is a right-tailed test, you can you a standard normal table and look up for P(Z>2.63). This will give you 0.0042. Similarly, using the z to p value calculator, the right-tailed p-value is 0.004237.
To find the right-tailed critical value, we need to use the z-table or the z-critical value calculator. Both of these methods will return the right-critical value for the test as 1.645 at 5% significance level.
Step 5: Decision
Since the p-value (0.004237) is less than α = 0.05, we reject the null hypothesis (H₀). Also, using the critical value approach, we can see that the absolute test statistic value (2.6326) is greater than the absolute critical value (1.645), and hence, we reject the null hypothesis.
Step 6: Conclusion
At the 0.05 significance level, there is sufficient evidence to conclude that the population mean examination score for Program 1 is greater than the population mean score for Program 2.
Verify Example 2 Using the Calculator
To verify the result using the two sample z test calculator, follow these steps:
- Select the alternative hypothesis as H₁: μ₁ − μ₂ > 0.
- Enter α = 0.05.
- Select Raw Data.
- Enter the Program 1 values in the Sample 1 field.
- Enter σ₁ = 5.0.
- Enter the Program 2 values in the Sample 2 field.
- Enter σ₂ = 4.5.
- Click Calculate.
The calculator will return approximately:
- Z statistic: 2.6326
- P-value: 0.004237
- Critical value: 1.6449
- Decision: Reject H₀
It will also show you how the test was performed using the six steps of hypothesis testing.
Frequently Asked Questions
It tests whether the means of two independent populations differ when both population standard deviations are known. The calculator returns the z statistic, p-value, critical value, decision, and a complete six-step solution.
Use a two sample z test when σ₁ and σ₂ are known population parameters. Use a t test when the population standard deviations are unknown and must be estimated from the samples.
No. The formula includes σ₁²/n₁ and σ₂²/n₂ separately. Thus, the two known population standard deviations may differ.
Yes. The calculator will calculate the sample mean and sample size for each group from the raw observations. You must still provide the known population standard deviation for each population.
No. A two sample z test for means compares two population means using quantitative data and known population standard deviations. On the other hand, a two proportion z test compares two population proportions using counts or percentages.
