
How to Use the Paired T Test Calculator
This paired t-test calculator will help you determine whether there is a significant mean difference between two matched pairs using either raw or summary data. To use the calculator:
- Select the alternative hypothesis.
- Enter the significance level, α.
- Choose Summary Data or Raw Paired Data.
- Enter the required values.
- Click Calculate.
The calculator will instantly return the t-statistic, p-value, and critical value for your test. You’ll also get a complete six-step hypothesis test solution to help you learn how to perform a paired t test manually using your own data.
Note. If you select the Summary Data option, you’ll need to enter the mean of the paired difference (d̄), sample standard deviation of the paired difference (sd), and the number of matched pairs (n). However, for the Raw Data option, you’ll enter raw values into the data input field and make sure they are separated using commas, spaces, tabs, or line breaks. Alternatively, you can copy-paste value directly from Excel, Google Sheets, or text documents.
What Is a Paired T Test?
A paired t test is a hypothesis test used to determine whether the population mean difference between two related measurements is significantly different from zero.
It is also known as a:
- Paired samples t test
- Dependent samples t test
- Dependent t test
- Matched-pairs t test
- Repeated-measures t test
The observations must have a meaningful one-to-one relationship. Common examples include measurements collected from the same participants at two different times, the same products tested under two conditions, or individuals deliberately matched using relevant characteristics.
Unlike an independent t test, a paired t test does not compare two unrelated sample means directly. It calculates one difference for every pair and analyzes the resulting sample of differences. In other words, a paired t test is equivalent to performing a one-sample t test on the paired differences.
When to Use a Paired T Test?
A paired t test is appropriate when you want to compare the mean of two related groups. It determines whether the mean difference between two sets of paired observations is significantly different from zero.
Therefore, you should use a paired t-test whenever you have:
- Repeated measures, where measurements are taken on the same subject, items, or people at two different time points
- Matched pairs, where each data point in one group is directly related to a data point in the other group
- The dependent variable is measured on a continuous scale
- The differences between the paired observations are approximately normally distributed
- The sample is randomly selected from the target population.
Paired T Test Formula
The test statistic formula for a paired t-test is:
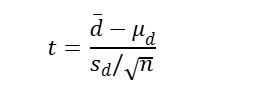
Where:
- t is the paired t-test statistic
- d̄ is the sample mean difference
- μd is the hypothesized population mean difference (usually 0)
- sd is the sample standard deviation of the differences
- n is the number of matched pairs
How to Perform a Paired T Test
A paired t test can be completed using the following six steps:
- State the null and alternative hypotheses.
- State the significance level.
- Calculate the test statistic.
- Find the p-value and critical value.
- Make the statistical decision.
- Write the conclusion in the context of the question.
In the next section, we demonstrate how to perform a paired t-test using the above steps using raw data and summary data examples.
Example 1: Raw Data
A researcher wants to determine whether a short training program changes reaction time. The same 10 participants complete a reaction-time task before and after training. Reaction time is measured in milliseconds.
| Participant | Before | After |
|---|---|---|
| 1 | 310 | 298 |
| 2 | 295 | 289 |
| 3 | 322 | 310 |
| 4 | 305 | 300 |
| 5 | 288 | 281 |
| 6 | 315 | 307 |
| 7 | 299 | 295 |
| 8 | 330 | 317 |
| 9 | 301 | 296 |
| 10 | 318 | 309 |
At the 0.05 significance level, is there evidence that the population mean reaction time changed after training?
Solution
Because the same participants were measured before and after training, the observations are related. Therefore, a paired t test is appropriate.
To perform the test manually, follow these steps:
Step 1: State the Hypotheses
The researcher wants to determine whether reaction time changed in either direction. Therefore, this is a two-tailed test.
The hypotheses are:
- H0: μd = 0
- H1 μd ≠ 0
Step 2: State the Significance Level
From the question, the significance level, α = 0.05
Step 3: Calculate the Test Statistic
By definition, the paired t test formula is: t = (d̄ -μd)/(sd/√n)
From the formula, we need to find the mean and standard deviation of the differences. To do that, follow these sub-steps:
i) Find the differences
Here find the differences by subtracting after scores from the before scores. The results are shown in the table below.
| Participant | Before | After | d = Before − After |
|---|---|---|---|
| 1 | 310 | 298 | 12 |
| 2 | 295 | 289 | 6 |
| 3 | 322 | 310 | 12 |
| 4 | 305 | 300 | 5 |
| 5 | 288 | 281 | 7 |
| 6 | 315 | 307 | 8 |
| 7 | 299 | 295 | 4 |
| 8 | 330 | 317 | 13 |
| 9 | 301 | 296 | 5 |
| 10 | 318 | 309 | 9 |
ii) Find the mean of the difference
The mean of the difference will give us d̄
Therefore, d̄ = (12+6+12+5+7+8+4+13+5+9)/10
=81/10
= 8.1
Alternatively, you can easily find the average of the differences using the average calculator.
iii) Find the sample standard deviation of the differences
By definition, the sample standard deviation formula is: s = √(Σx2 – nx̄2)/(n-1)
Σx2 is equivalent to finding the sum of all squared differences. Thus, Σx2 = 122+62+122+52+72+82+42+132+52+92
=753
You can also confirm the value using the sum of squares calculator.
Now, we can compute the sample standard deviation of the differences as follows: sd =√(753-10(8.1)2/(10-1)
=√10.76667
=3.28126
Want to instantly get the sample standard deviation without manual process? Use the sample standard deviation calculator for instant answer and step-by-step explanation.
iv) Find the test statistic
Recall, the paired t statistic formula is t = (d̄ -μd)/(sd/√n)
Substituting the values into the formula and solving, we get:
t = (8.1-0)/(3.28126/√10)
=8.1/1.0376
=7.8063
Recall. sd/√n can also be referred to as the standard error of the mean difference. You can actually compute this part by pasting the differences in the standard error calculator and clicking the calculate button.
Step 4: Find the P-Value and Critical Value
To find the p-value, you need the test statistic and degrees of freedom. For a paired t-test, the degrees of freedom formula is: df=n-1, where n is the number of matched pairs.
Since there are 10 matched pairs, then n = 10. Therefore, df = 10-1
= 9.
You can also verify this using the degrees of freedom calculator. Since this is a two-tailed test, you can use the following excel formula to get the p-value =T.DIST.2T(ABS(7.8063), 9). Alternatively, using the p-value calculator from t, the two-tailed p-value for the test is: 0.000027
For the critical value, you need to use a t table and lookup the value at: t0.05/2, 9 = ±2.2622. Alternatively, you can instantly get the same critical value using the critical t value calculator.
Step 5: Make the Decision
Since the p-value (0.000027) is less than the 0.05 significance level, we reject the null hypothesis. Also, the test statistic (7.8063) is greater than the absolute critical value (2.2622), we reject the null hypothesis.
Step 6: Write the Conclusion
At the 0.05 significance level, there is sufficient evidence to conclude that the population mean reaction time changed after training.
Verify Example 1 Using the Calculator
To verify the result using the paired t test calculator, follow these steps:
- Select alternative hypothesis: H₁: μd ≠ 0
- Significance level: α = 0.05
- Select the Raw Data option
- Copy and paste these values: 310, 295, 322, 305, 288, 315, 299, 330, 301, 318 into the Measurement 1 input field and 298, 289, 310, 300, 281, 307, 295, 317, 296, 309 into the Measurement 2 input field
- Click Calculate
The calculator will instantly return similar results as shown below.
- Test statistic: t (9) = 7.8063
- P-value: 0.000027
- Critical value: ±2.2622
You’ll also get a clear, step-by-step explanation showing you exactly how to the test was done using this data.
Example 2: Summary Data
A school recently introduced a test-preparation workshop and wants to know if it actually helps improve student performance. To find out, the exact same group of 16 students took an examination both before and after completing the workshop. When tracking individual progress (d = After score – Before score), researchers found that the average improvement was 3.6 points, with a sample standard deviation of 4.8 points. At a 0.05 significance level, is there enough evidence to prove that the workshop significantly changes overall examination scores?
Solution
From the question, we have summary data for the paired differences. In particular, we know that:
- Mean of the paired differences, d̄ = 3.6
- Sample standard deviation of the paired differences, sd = 4.8
- Number of matched pairs, n = 16
To conduct the paired t test manually using the summary data, follow these steps.
Step 1: Hypotheses
The researcher wants to determine whether examination scores changed in either direction. Therefore, this is a two-tailed paired t test.
The hypotheses are:
H₀: μd = 0
H₁: μd ≠ 0
Here, μd is the population mean of the differences between the after-workshop and before-workshop scores.
Step 2: Significance Level
From the question, we need to test the hypothesis at the 0.05 significance level. Thus, α = 0.05
Step 3: Test Statistic
By definition, the test statistic formula for a paired t test is:
t = (d̄ − μd)/(sd/√n)
Under the null hypothesis: μd = 0
Therefore, the formula becomes: t = d̄/(sd/√n)
Substituting the values into the formula, we get: t = 3.6/(4.8/√16)
= 3.6/1.2
= 3.00
Step 4: P-Value and Critical Value
Using the p-value from t calculator, the two-tailed p-value for the test is 0.008973. Alternatively, you can find the p-value using the Excel formula: =T.DIST.2T(ABS(3.00), 15), where 15 is the degrees of freedom for the test and 3.00 is the test statistic.
For the critical value, we need to find t0.05/2, 15 using the t-distribution table. This gives ±2.1314. However, if you prefer quick results, our t critical value calculator will yield similar result.
Recall that 15 is the number of degrees of freedom for the paired t test. It is calculated using the formula: df = n − 1, where is the number of matched pairs. Thus, df = 16-1 = 15
Step 5: Decision
Since the p-value (0.008973) is less than the significance level (0.05), we reject the null hypothesis.
Alternatively, since the absolute test statistic (3.0000) is greater than the absolute critical value (2.1314), we reject the null hypothesis.
Step 6: Conclusion
At the 0.05 significance level, there is sufficient evidence to conclude that the workshop changes the population mean examination score.
Using the Calculator
You can also verify the results using the paired t test calculator by following these steps:
- Select the alternative hypothesis as H₁: μd ≠ 0.
- Enter the significance level, α = 0.05.
- Choose Summary Data.
- Enter the mean difference, d̄ = 3.6, standard deviation of the differences, sd = 4.8, and number of matched pairs, n = 16.
- Click Calculate.
The calculator will instantly return:
- Test statistic, t(15) = 3.0000
- P-value = 0.008973
- Critical values = ±2.1314
Additionally, you’ll also see a clear, step-by-step solution of how the test was performed using the 6 steps of hypothesis testing.
Frequently Asked Questions
It determines whether the population mean difference between two related measurements is significantly different from zero. It returns the t statistic, p-value, and critical value. Want to learn how to perform the test manually? The calculator also provides a clear, step-by-step solution showing you exactly how the test was performed using your own data.
Yes. Paired t test, dependent samples t test, matched-pairs t test, and dependent t test commonly refer to the same statistical procedure.
The calculator allows you to enter two matched lists of raw observations or summary data such as the mean difference, standard deviation of the paired differences, and the number of pairs.
The degrees of freedom are df=n-1, where n is the number of matched pairs.
Not necessarily. The main normality assumption applies to the paired differences.
