
How to Use the Correlation Coefficient Calculator
This calculator helps you find Pearson’s correlation coefficient (r) from two sets of paired quantitative data. To use the calculator:
- Enter or paste the values for the first variable into the X Values field.
- Enter or paste the corresponding values for the second variable into the Y Values field.
- Select the number of decimal places you want.
- Click Calculate.
The calculator instantly returns Pearson’s correlation coefficient, an interpretation of the strength and direction of the relationship, and a complete step-by-step solution of how the coefficient was computed.
Tip. The X and Y fields must contain the same number of values because each X value must be paired with its corresponding Y value. Also, when entering the data manually, you should separate the values using commas, spaces, tabs, or line breaks. The input fields also allow you to copy-paste values directly from Excel, Google Sheets, or Text documents.
What Is a Correlation Coefficient?
A correlation coefficient is a statistical measure of the strength and direction of the linear relationship between two variables. This calculator computes Pearson’s correlation coefficient, r, which measures the strength and direction of a linear relationship between two quantitative variables. If the variables are not quantitative, you should consider using the Spearman’s correlation coefficient calculator.
The correlation coefficient value (r) lies between -1 and +1, with positive values indicating that the two variables move together and negative values indicating that the two variables move in the opposite direction. A correlation coefficient value of zero (r = 0), indicates that there is no relationship between the two variables.
The table below provides a quick summary of how to interpret correlation coefficient values.
| Value of r | Interpretation |
| r = +1 | Perfect positive linear correlation |
| r is close to +1 | Strong positive linear correlation |
| r is close to 0 | Weak or no linear correlation |
| r is close to −1 | Strong negative linear correlation |
| r = −1 | Perfect negative linear correlation |
As you can see from the above table, the sign of a correlation coefficient value shows the direction of the correlation, while the absolute value shows its strength. For example, r = 0.85 and r = −0.85 have the same strength. However, the first represents a positive relationship, while the second represents a negative relationship.
Note. The correlation coefficient is a measure of association and not causation. As such, a strong correlation value does not prove that changes in one variable directly cause changes in the other but rather indicates that the variables move together or in opposite directions.
Correlation Coefficient Formula
The Pearson correlation coefficient formula for raw paired data is:
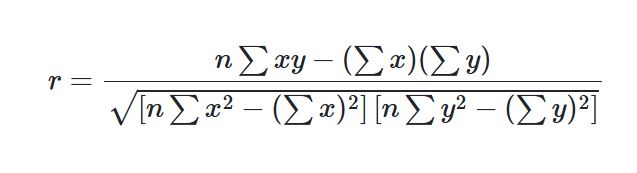
Where:
- r is Pearson’s correlation coefficient
- n is the number of paired observations
- Σx is the sum of the X values
- Σy is the sum of the Y values
- Σx² is the sum of the squared X values
- Σy² is the sum of the squared Y values
- Σxy is the sum of the products of each X-Y pair
How to Calculate the Correlation Coefficient by Hand
To calculate Pearson’s correlation coefficient from raw paired data:
- Write down the Pearson correlation formula.
- Calculate x², y², and xy for each pair, then find n, Σx, Σy, Σx², Σy², and Σxy.
- Substitute the values into the formula and solve for r.
- Interpret the sign and absolute value of r.
Example 1
Suppose a researcher records the number of hours eight students study and their corresponding quiz scores.
| Student | Study Hours, X | Quiz Score, Y |
|---|---|---|
| 1 | 1 | 2 |
| 2 | 2 | 4 |
| 3 | 3 | 5 |
| 4 | 4 | 4 |
| 5 | 5 | 5 |
| 6 | 6 | 7 |
| 7 | 7 | 8 |
| 8 | 8 | 9 |
Find the correlation coefficient between study hours and quiz scores and interpret the result.
Solution
To find the correlation coefficient for the above data, follow these steps:
Step 1: State the formula
Recall. The Pearson’s correlation coefficient formula is:
Step 2: Calculate the required sums
Based on the formula, we need n, Σx, Σy, Σx², Σy², and Σxy. The table below shows how to compute each of these sums
| Student | x | y | x² | y² | xy |
| 1 | 1 | 2 | 1² = 1 | 2² = 4 | 1 × 2 = 2 |
| 2 | 2 | 4 | 2² = 4 | 4² = 16 | 2 × 4 = 8 |
| 3 | 3 | 5 | 3² = 9 | 5² = 25 | 3 × 5 = 15 |
| 4 | 4 | 4 | 4² = 16 | 4² = 16 | 4 × 4 = 16 |
| 5 | 5 | 5 | 5² = 25 | 5² = 25 | 5 × 5 = 25 |
| 6 | 6 | 7 | 6² = 36 | 7² = 49 | 6 × 7 = 42 |
| 7 | 7 | 8 | 7² = 49 | 8² = 64 | 7 × 8 = 56 |
| 8 | 8 | 9 | 8² = 64 | 9² = 81 | 8 × 9 = 72 |
| Total | Σx = 36 | Σy = 44 | Σx² = 204 | Σy² = 280 | Σxy = 236 |
From the table, we see that:
- The number of pairs, n = 8
- Σx = 36
- Σy = 44
- Σx² = 204
- Σy² = 280
- Σxy = 236
Step 3: Substitute the values into the formula
Substituting the values from step 2 into the correlation coefficient formula, we get:
= 304 / √(336 × 304)
= 304 / 319.5997
r = 0.9512
Therefore, the correlation coefficient for the data is: r = 0.9512.
Step 4: Interpret the correlation coefficient
The correlation coefficient value (r = 0.9512) is close to 1 and positive. This implies that there is a very strong positive linear relationship between study hours and quiz scores. The positive correlation suggests that students who study for more hours generally tend to have higher quiz scores. However, it does not prove that studying for longer causes higher quiz scores.
Want to know whether this relationship is statistically significant? Use the p-value from r calculator to find the p-value and compare it with your significance level, or use the Pearson correlation test calculator to perform the complete hypothesis test.
Finding Correlation Coefficient (r) from Covariance and Standard Deviations
If the covariance and standard deviations of the two variables are already known, we can calculate Pearson’s correlation coefficient using the following formula:
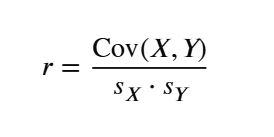
Where:
- Cov(X, Y) is the sample covariance between X and Y
- sₓ is the sample standard deviation of X
- sᵧ is the sample standard deviation of Y
If the variances are given instead of the standard deviations, you should first find the standard deviations by taking the square root of the variances. That is:
- sₓ = √sₓ²
- sᵧ = √sᵧ²
When working with raw data and want to use this correlation coefficient formula, you can use the covariance calculator, standard deviation calculator, or the variance calculator to verify your results.
Example 2
Suppose a college instructor studies the relationship between weekly study time and exam scores. The following sample statistics are given:
- Cov(X,Y) = 12
- Variance of study time, sₓ² = 4
- Variance of exam scores, sᵧ² = 100
Find Pearson’s correlation coefficient.
Solution
Since the variances are given, we need to first find the standard deviations.
sₓ = √4
= 2
sᵧ = √100
= 10
Now, using the covariance-standard deviation method, we can calculate the correlation coefficient as follows:
r = Cov(X,Y) /sₓsᵧ
Substituting the values gives:
r = 12 / (2 × 10)
= 12 / 20
= 0.60
Therefore, Pearson’s correlation coefficient, r = 0.60.
Since r is positive, the variables have a positive linear relationship. The correlation coefficient, r = 0.60, indicates a strong positive linear correlation between weekly study time and exam scores.
How to Interpret the Strength of Correlation Coefficient, r
The calculator classifies the strength of the correlation coefficient using the absolute value of r. The table below provides a quick summary to help you determine the strength of a correlation coefficient value.
| Absolute value of r | Interpretation |
| 0.00 to 0.19 | Very weak |
| 0.20 to 0.39 | Weak |
| 0.40 to 0.59 | Moderate |
| 0.60 to 0.79 | Strong |
| 0.80 to 1.00 | Very strong |
For example:
- r = 0.72 indicates a strong positive linear correlation.
- r = −0.72 indicates a strong negative linear correlation.
- r = 0.15 indicates a very weak positive linear correlation.
Note. These ranges in the table above are practical guidelines rather than strict rules. The importance of a correlation depends on the subject area, sample size, measurement quality, and purpose of the analysis.
It is also worth noting that a correlation can be statistically significant without being practically important. Large samples can make relatively small correlations significant.
Positive vs Negative Correlation
A positive correlation means the two variables tend to move in the same direction. As X increases, Y generally tends to increase. For example, study time and exam scores may have a positive correlation if students who study for longer tend to earn higher scores.
On the other hand, a negative correlation means the variables tend to move in opposite directions. As X increases, Y generally tends to decrease. For example, the number of classes missed and exam scores may have a negative correlation if students with more absences tend to earn lower scores.
The sign of r tells you the direction of the relationship. It does not tell you the strength by itself.
Correlation and Scatter Plots
Before interpreting a correlation coefficient, it is useful to look at the paired data on a scatter plot. A scatter plot helps you see the direction and form of the relationship and can reveal unusual values that may affect Pearson’s r. You can use our scatter plot maker to plot your X-Y data.
For Pearson’s correlation, the main pattern to look for is a linear relationship. If the points generally rise from left to right, the correlation is positive. However, if they generally fall from left to right, the correlation is negative. The more closely the points follow a straight-line pattern, the closer the absolute value of r will usually be to 1.
A scatter plot is also useful because r alone may not clearly show a curved relationship or the effect of an extreme outlier.
Frequently Asked Questions
A correlation coefficient calculator is an online tool that finds Pearson’s r from two sets of paired quantitative data. It measures the strength and direction of the linear relationship between the two variables.
Enter the observations for the first variable in the X field and the corresponding observations for the second variable in the Y field. The two fields must contain the same number of values, and each X value should correspond to the Y value in the same position.
Yes. You can copy and paste paired data from Excel or Google Sheets. You can paste each column separately or paste two paired columns directly into the calculator.
A negative value of r means that the variables tend to move in opposite directions. As one variable increases, the other generally tends to decrease.
An r value of 0 means that there is no linear correlation between the variables. A nonlinear relationship may still be present.
No. Correlation shows association, not causation. A strong value of r does not by itself prove that one variable causes changes in another.
No. Pearson’s correlation coefficient always falls between −1 and +1.
