
Are the variances assumed to be equal? Use the two sample t-test calculator instead. Additionally, if the population standard deviations for the two groups are already known, then you should use the two sample z test calculator.
How to Use the Welch’s T Test Calculator
This calculator helps you perform an independent sample t-test when the variances are unequal using either raw or summary statistics data. To use the calculator:
- Select the alternative hypothesis.
- Enter the significance level, α.
- Choose Summary Data or Raw Data.
- Enter the information for both independent samples.
- Click Calculate.
The calculator will instantly return the test statistic, p-value, and critical value for the test. It will also provide a clear, step-by-step solution, showing you how to perform the Welch’s T-Test manually using the 6 steps of hypothesis testing.
Tip. If you only have the summary statistics (sample mean, sample size, and sample standard deviation), just select the summary data option. However, if you have the raw data and have already confirmed the variances are unequal, select the Raw Data option and enter the raw values in the data input field. You can separate these values using commas, spaces, tabs, or line break. The calculator does also allow you to copy-paste values directly from Excel, Google Sheets, or text documents.
Still unsure whether the homogeneity of variance assumption is met? Use the F-test for equality of variance calculator to test this assumption.
What Is Welch’s T Test?
Welch’s t test is a hypothesis test used to compare the means of two independent populations when the population standard deviations are unknown and equal variances cannot be assumed. In other words, a Welch’s t-test is an alternative to an independent sample t-test, when the equality of variance assumption is violated. It adjusts the degrees of freedom using the Welch-Satterthwaite equation, preventing inflated Type I error rates.
The test is often referred to as:
- Welch’s unequal variances t test
- Unequal variance t test
- Welch–Satterthwaite t test
- Unequal variances independent samples t test
Therefore, like the two samples t-test, the Welch’s t-test aims to determine whether there is a significant mean difference between two independent populations, particularly when the population variances are assumed to be unequal.
When to Use Welch’s T Test?
Use Welch’s t test when:
- You want to compare the means of two independent groups.
- The outcome variable is continuous
- The population standard deviations are unknown.
- Equal population variances cannot be reasonably assumed.
- The sample sizes may be different.
- The observations in one group are unrelated to those in the other group.
Assumptions of Welch’s T Test
Like the 2 samples t test, the Welch’s t test applies all the assumptions except the homogeneity of variance assumption. Therefore, to use the Welch’s t-test, the following assumptions must be met.
- There should be one dependent variable measured on a continuous scale
- There should be two independent groups
- The observations within each group should be independent
- The populations are approximately normally distributed
- The population variances should be unequal
Welch’s T Test Formula
The test statistic formula for a Welch’s t test is:
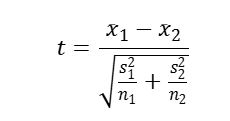
Where:
- x̄1 is the sample mean of Group 1
- x̄2 is the sample mean of Group 2
- s1 is the sample standard deviation of Group 1
- s2 is the Sample standard deviation of Group 2
- n1 is the sample size of Group 1
- n2 is the sample size of Group 2
Welch–Satterthwaite Degrees of Freedom
Unlike the two-sample t-test which find the degrees of freedom using the formula: df = n1+n2-2, the Welch’s degrees of freedom are estimated using the Welch–Satterthwaite equation. The formula is:
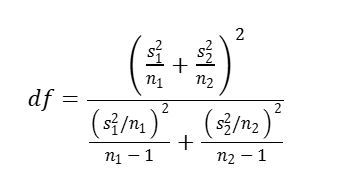
From the formula, it is clear that the degrees of freedom can be decimal.
How to Perform a Welch’s T Test
To perform a welch’s t test by hand, we follow the 6 standard steps of hypothesis testing. To help you learn, let’s consider an example.
Example
A researcher compares the examination scores of students taught using two different methods. The first independent sample contains 18 students and has a mean score of 74.8 with a standard deviation of 9.6. The second sample contains 12 students and has a mean score of 67.1 with a standard deviation of 15.2. Because the sample standard deviations differ considerably and the sample sizes are unequal, the researcher uses Welch’s t test. At the 0.05 significance level, is there evidence that the population mean scores are different?
Solution
From the question, we know that:
- Sample mean of group 1, x̄1 = 74.8
- Sample standard deviation of group 1, s1 = 9.6
- Sample size of group 1, n1 = 18
- Sample mean of group 2, x̄2 = 67.1
- Sample standard deviation of group 2, s2 = 15.2
- Sample size of group 2, n2 = 12
Therefore, to perform the test by hand, follow these steps:
Step 1: State the hypotheses
The researcher wants to detect a difference in either direction. Thus, this is a two-tailed test.
The hypotheses are:
- H0:μ1−μ2=0
- H1:μ1−μ2 ≠ 0
Step 2: State the significance level
From the question, the significance level, α = 0.05
Step 3: Calculate the test statistic
By definition, the test statistic formula for a Welch’s t-test is: t = (x̄1 – x̄2)/√(s12/n1 +s22/n2)
Substituting the values into the formula, we have:
t = (74.8 – 67.1)/√(9.62/18 + 15.22/12)
=7.7/√24,3733
=1.5597
Step 4: Find the p-value and critical value
Using the p-value calculator from t, the two-tailed p-value for the test is 0.137413.
Next, we need to find the t-critical value for the test. Since this is a two-tailed test, the critical value formula is: t0.05/2, df. This means we need to first find the degrees of freedom before looking up the value from a t-table.
Applying the Welch–Satterthwaite degrees of freedom formula, we get:
Using a t-table or a t critical value calculator, the two-tailed critical value for the test is: t0.05/2, 16.9=±2.1112
Step 5: Make the decision
Since the p-value (0.137413) is greater than the 0.05 significance level, we fail to reject the null hypothesis. Also, the t-statistic (1.5597) is less than the absolute critical value (2.1112), suggesting that we should fail to reject the null hypothesis.
Step 6: Write the conclusion
At the 0.05 significance level, there is not enough evidence to conclude that the two population mean examination scores are different.
Frequently Asked Questions
It compares the means of two independent populations without assuming equal variances. The calculator instantly returns the t statistic, adjusted degrees of freedom, p-value, and critical value. You also get a clear, step-by-step solution showing you exactly how to perform the test manually.
Use it when comparing two independent means and equal population variances cannot be assumed. It is particularly helpful when sample variances and sample sizes differ.
No. That is the main reason for using Welch’s procedure instead of the pooled two-sample t test.
They are estimated using the Welch–Satterthwaite approximation. The resulting value does not have to be a whole number and can be used directly to evaluate the t distribution.
