
How to Use the Fisher’s Exact Test Calculator
This Fisher’s exact test calculator helps you determine whether there is an association between two categorical variables, especially when your data sample size is very small or when expected cell counts are less than 5. If all the expected cell counts are at least 5, you should use the chi-square calculator instead.
To use the calculator:
- Select the correct alternative hypothesis (Two-sided, right-sided, or left-sided)
- Edit the variable names in the 2 × 2 contingency table.
- Enter the four observed counts in the 2 × 2 contingency table.
- Enter the significance level, α.
- Click Calculate
The calculator will instantly perform Fisher’s exact test and return the observed table probability, odds ratio (OR), exact p-value, and the correct decision about the hypothesis. It will also provide a clear, step-by-step solution showing you exactly how to perform the test manually.
Tip. You should only use this calculator when you have two categorical variables summarized in a 2 × 2 contingency table.
What Is Fisher’s Exact Test?
Fisher’s exact test is a nonparametric test used to determine whether there is a nonrandom association between two categorical variables. It is appropriate when working with a 2 × 2 contingency table with small expected counts, especially when standard approximations like the chi-square test fail or become unreliable.
The test is particularly useful when the sample is small or one or more expected cell counts are too low for the chi-square approximation. Unlike a chi-square test, Fisher’s exact test calculates probabilities directly. It does not require a chi-square statistic, critical value, or degrees of freedom.
When to Use Fisher’s Exact Test
Fisher’s exact test is appropriate when:
- You have two categorical variables.
- Each variable has exactly two categories.
- The sample is small for a chi-square test approximation
- One or more expected cell counts are less than 5
- The data can be arranged in a 2 × 2 table.
- The table contains observed counts.
- The observations are independent.
- Each participant or observation appears in only one cell.
For larger contingency tables, use the chi-square test calculator. However, to compare one categorical variable with a specified expected distribution, use the chi-square goodness-of-fit calculator.
Hypotheses for Fisher’s Exact Test
The null hypothesis for a 2 × 2 contingency table states that the two variables are independent. This is equivalent to stating that the population odds ratio equals 1.
However, the alternative hypothesis for the test can be either of these:
- Two-Sided Test. This is appropriate when you want to test whether there is an association in either direction. The alternative hypothesis is:
- H₁: There is an association between the two categorical variables; OR ≠ 1.
- Right-tailed Test. Use this test when you predict that the odds of the first column outcome are higher in the first row than in the second row. In this case, the alternative hypothesis is:
- H₁: OR > 1.
- Left-tailed Test. The left-sided test is appropriate when you predict that the odds of the first column outcome are lower in the first row. Therefore, the alternative hypothesis is:
- H₁: OR < 1.
Note. The order of the rows and columns affects the direction of the odds ratio and one-sided hypotheses. Use the two-sided option when there is no justified directional prediction.
Fisher’s Exact Test Formula
To understand Fisher’s exact test formula, consider the following general 2 × 2 contingency table
| Column 1 | Column 2 | Total | |
|---|---|---|---|
| Row 1 | a | b | a + b |
| Row 2 | c | d | c + d |
| Total | a + c | b + d | n |
Using the contingency table, Fisher’s exact formula is the probability of obtaining a particular 2 × 2 table. The formula is:
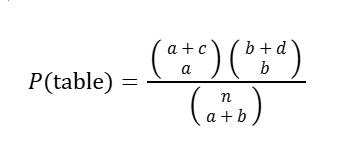
Where:
- a, b, c, and d are the four observed counts.
- n = a + b + c + d is the total sample size.
Example 1. Finding Fisher’s Exact Test Manually
A community college wants to determine whether participation in a mathematics tutoring program is associated with passing a final examination. Eight students receive the tutoring program, while another eight receive standard academic support. The results are shown below.
| Academic support | Passed | Did not pass | Total |
|---|---|---|---|
| Tutoring program | 6 | 2 | 8 |
| Standard support | 1 | 7 | 8 |
| Total | 7 | 9 | 16 |
At the 5% significance level, test whether academic support type and examination outcome are associated.
Solution
The appropriate test is Fisher’s exact test since the sample is small and some of the expected frequencies are less than 5. To perform the test, follow these steps:
Step 1: State the Hypotheses
Because the question asks whether an association exists without specifying a direction, we use a two-sided test. Therefore, the hypotheses are:
- H₀: Academic support type and examination outcome are independent; OR = 1.
- H₁: Academic support type and examination outcome are associated; OR ≠ 1.
Step 2: State the Significance Level
We need to test the hypothesis at a 5% significance level. Hence, α = 0.05
Step 3: Calculate the Observed Table Probability
From the contingency table, we know that:
- a = 6
- b = 2
- c = 1
- d = 7
Substituting the values into Fisher’s exact test formula, we get:
= 0.019580
Therefore, P(observed table) = 0.019580
Step 4: Calculate the Odds Ratio and Exact P-Value
The sample odds ratio is:
=21
This implies that the sample odds of passing are 21 times as high in the tutoring group as in the standard-support group.
To find the exact p-value for the two-tailed test, we sum all the probabilities of the observed table and all equally or less probable tables. This gives p = 0.040559
Step 5. State the Decision
Since the p-value (0.040559) is less than the 0.05 significance level, we reject the null hypothesis
Step 6. Write the Conclusion
At the 5% significance level, there is sufficient evidence to conclude that academic support type and examination outcome are associated.
Example 2. Finding Fisher’s Exact Test Using the Calculator
To perform Fisher’s exact test for Example 1 using the calculator, follow these steps:
- Select Two-Sided: OR ≠ 1 as the alternative hypothesis
- Edit the variable names to match the above contingency table
- Enter the observed counts to match the above contingency table
- Enter 0.05 as the significance level
- Click calculate
The calculator will instantly return the observed table probability, odds ratio, exact p-value, and decision, as follows:
- Observed table probability = 0.019580
- Sample odds ratio = 21
- Exact p-value = 0.040559
- Decision: Reject H₀
You’ll also see a clear, step-by-step solution explaining how the test was performed.
Frequently Asked Questions
It tests whether two categorical variables are associated in a 2 × 2 contingency table. It is especially useful for small samples or tables with low expected frequencies.
Not usually. The observed table probability applies only to the exact table entered. The exact p-value also includes other relevant tables that are at least as extreme under the selected hypothesis.
Use Fisher’s exact test when the data form a 2 × 2 table, and the sample or expected frequencies are small. However, if the approximation is appropriate, or the contingency table is larger, use the chi-square test.
Yes. The exact p-value can still be calculated as long as each row and column has a positive total. The sample odds ratio may become zero, infinite, or undefined.
No. The p-value is calculated directly from exact conditional probabilities, so a chi-square distribution and degrees of freedom are not required.
Use a two-sided test when an association in either direction would be important. However, if a directional hypothesis was established before examining the results, use a one-sided test instead.
