
How to Use the Spearman Correlation Coefficient Calculator
This calculator quickly computes Spearman’s rank correlation coefficient when you want to measure the strength and direction of a monotonic relationship between two variables.
To use the calculator:
- Enter or paste the values for the first variable into the X Values field.
- Enter or paste the corresponding values for the second variable into the Y Values field.
- Select the number of decimal places you want.
- Click Calculate.
The calculator instantly returns Spearman’s rank correlation coefficient, rₛ, together with a clear step-by-step solution showing how the coefficient was calculated. If the data contain tied values, it assigns average ranks to the tied observations and uses the appropriate rank-correlation calculation automatically.
Tip. The X and Y fields must contain the same number of values because each X value must correspond to a Y value. You can enter the data manually or paste values directly from Excel, Google Sheets, or a text document. When entering values manually, separate them using spaces, tabs, line breaks, or commas.
Need to compute Pearson’s correlation instead? Use the correlation coefficient calculator.
What Is Spearman’s Rank Correlation Coefficient?
Spearman’s rank correlation coefficient is a nonparametric measure of the strength and direction of a monotonic relationship between two variables. It is commonly represented by rₛ, although some textbooks use ρ or ρₛ.
Spearman correlation works with the ranks of the observations rather than their original numerical values. This makes it useful for ordinal or ranked data and for relationships that consistently increase or decrease without following a straight line.
Like Pearson’s correlation coefficient, Spearman’s rₛ ranges from −1 to +1. The table below provides a quick guide to interpreting the coefficient.
| Value of rₛ | Interpretation |
|---|---|
| rₛ = +1 | Perfect positive monotonic correlation |
| rₛ close to +1 | Strong positive monotonic correlation |
| rₛ close to 0 | Weak or no monotonic correlation |
| rₛ close to −1 | Strong negative monotonic correlation |
| rₛ = −1 | Perfect negative monotonic correlation |
The sign of rₛ shows the direction of the relationship, while its absolute value shows the strength.
Spearman Correlation Formula
The formula used to calculate Spearman’s correlation depends on whether the data contain tied ranks. If every observation has a unique rank, Spearman’s rank correlation coefficient formula is:
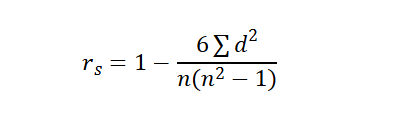
Where:
- rₛ is Spearman’s rank correlation coefficient
- d is the difference between the X rank and Y rank for each observation
- d² is the squared rank difference
- Σd² is the sum of the squared rank differences
- n is the number of paired observations
Sometimes, a tie can occur, especially when two or more observations have the same value. In this case, we assign each tied observation the average of the ranks it would occupy, then calculate Spearman’s correlation from the resulting ranks.
The formula is:

Where:
- Rₓ is the rank of each X value
- Rᵧ is the rank of each Y value
- R̄ₓ is the mean of the X ranks
- R̄ᵧ is the mean of the Y ranks
The calculator checks for tied values automatically. If ties are present, it assigns average ranks and calculates Spearman’s rₛ from the ranked data.
How to Calculate Spearman’s Correlation by Hand
To calculate Spearman’s rank correlation coefficient manually, follow these steps:
- State the Spearman correlation formula.
- Rank the values and calculate the rank differences. Rank the X and Y values separately from smallest to largest, calculate d = Rank X − Rank Y, square the differences to get d², and find Σd². If tied values occur, assign each tied value the average of the ranks it would occupy.
- Apply the formula. Substitute the required values into the Spearman correlation formula and calculate rₛ.
- Interpret the result. Use the sign of rₛ to determine the direction of the relationship and its absolute value to describe the strength.
Example 1. No Ties
Suppose a researcher wants to examine the relationship between the number of hours students study each week and their test scores. The researcher collects the following data from eight students.
| Student | Study Hours, X | Test Score, Y |
|---|---|---|
| 1 | 2 | 61 |
| 2 | 4 | 65 |
| 3 | 5 | 72 |
| 4 | 6 | 68 |
| 5 | 8 | 78 |
| 6 | 9 | 85 |
| 7 | 11 | 82 |
| 8 | 13 | 91 |
Find Spearman’s rank correlation coefficient.
Solution
Step 1: State the Spearman Correlation Formula
Since there are no tied values, the appropriate formula is: rₛ = 1 − 6Σd² / [n(n² − 1)]
Step 2: Rank the Values and Calculate the Rank Differences
Rank the X and Y values separately from smallest to largest. Then calculate: d = Rank X − Rank Y. You should then square each difference to get d². The table below shows the complete steps.
| X | Y | Rank X | Rank Y | d | d² |
|---|---|---|---|---|---|
| 2 | 61 | 1 | 1 | 0 | 0 |
| 4 | 65 | 2 | 2 | 0 | 0 |
| 5 | 72 | 3 | 4 | −1 | 1 |
| 6 | 68 | 4 | 3 | 1 | 1 |
| 8 | 78 | 5 | 5 | 0 | 0 |
| 9 | 85 | 6 | 7 | −1 | 1 |
| 11 | 82 | 7 | 6 | 1 | 1 |
| 13 | 91 | 8 | 8 | 0 | 0 |
From the table, Σd² = (0 + 0 + 1 + 1 + 0 + 1 + 1 + 0)
= 4
Also, there are 8 pairs of observations. Hence, n = 8.
Step 3: Apply the Formula
Substituting Σd² = 4 and n = 8 into the Spearman correlation formula, we get:
rₛ = 1 − 6(4) / [8(8² − 1)]
= 1 − 24 / [8(63)]
= 1 − 24 / 504
r = 0.9524
Therefore, Spearman’s rank correlation coefficient, rₛ = 0.9524.
Step 4: Interpret the Result
The value rₛ = 0.9524 indicates a very strong positive monotonic correlation between weekly study hours and test scores.
Want to visualize the data before computing the correlation? Use the scatter plot maker.
How to Deal with Ties
A tie occurs when two or more observations have the same value. For example, suppose the values are: 2, 4, 4, 7. The two values of 4 would occupy ranks 2 and 3. Since the values are equal, we should assign both the average of those ranks.
Therefore, average rank = (2 + 3) / 2
= 2.5
Hence, the ranks become: 1, 2.5, 2.5, 4.
This also applies when more than two observations have ties. For example, if three equal values occupy ranks 3, 4, and 5:
The average rank is: (3 + 4 + 5) / 3
= 4
Each tied value receives rank 4.
After assigning the average ranks to those that have ties, we then calculate Spearman’s correlation from the ranked data. This Spearman’s correlation coefficient calculator automatically detects ties and applies the correct computation.
Example 2. Ties
Suppose a researcher records students’ class participation ratings and their final project scores.
| Student | Participation Rating, X | Project Score, Y |
|---|---|---|
| 1 | 1 | 55 |
| 2 | 2 | 62 |
| 3 | 2 | 68 |
| 4 | 3 | 70 |
| 5 | 4 | 78 |
| 6 | 4 | 82 |
| 7 | 5 | 88 |
| 8 | 5 | 88 |
Find Spearman’s rank correlation coefficient.
Solution
Step 1: State the Spearman Correlation Formula
Because the data contain tied values, we first assign average ranks to the tied observations and then calculate Spearman’s correlation from the ranked data using:
rₛ = Σ(Rₓ − R̄ₓ)(Rᵧ − R̄ᵧ) / √[Σ(Rₓ − R̄ₓ)² Σ(Rᵧ − R̄ᵧ)²]
Step 2: Rank the Values and Calculate the Required Quantities
Rank the X and Y values separately from smallest to largest.
For X, the two values of 2 occupy ranks 2 and 3. Therefore, average rank = (2 + 3) / 2
= 2.5
The two values of 4 occupy ranks 5 and 6. Hence, average rank = (5 + 6) / 2
= 5.5
The two values of 5 occupy ranks 7 and 8. Thus, average rank = (7 + 8) / 2
= 7.5
For Y, the two scores of 88 occupy ranks 7 and 8. Therefore, average rank = (7 + 8) / 2
= 7.5
Since n = 8, the mean rank for both variables is:
R̄ₓ = R̄ᵧ = (n + 1) / 2
= (8 + 1) / 2
= 4.5
We can now calculate the quantities required in the formula.
| X | Y | Rₓ | Rᵧ | Rₓ − R̄ₓ | Rᵧ − R̄ᵧ | (Rₓ − R̄ₓ)(Rᵧ − R̄ᵧ) | (Rₓ − R̄ₓ)² | (Rᵧ − R̄ᵧ)² |
|---|---|---|---|---|---|---|---|---|
| 1 | 55 | 1 | 1 | −3.5 | −3.5 | 12.25 | 12.25 | 12.25 |
| 2 | 62 | 2.5 | 2 | −2.0 | −2.5 | 5.00 | 4.00 | 6.25 |
| 2 | 68 | 2.5 | 3 | −2.0 | −1.5 | 3.00 | 4.00 | 2.25 |
| 3 | 70 | 4 | 4 | −0.5 | −0.5 | 0.25 | 0.25 | 0.25 |
| 4 | 78 | 5.5 | 5 | 1.0 | 0.5 | 0.50 | 1.00 | 0.25 |
| 4 | 82 | 5.5 | 6 | 1.0 | 1.5 | 1.50 | 1.00 | 2.25 |
| 5 | 88 | 7.5 | 7.5 | 3.0 | 3.0 | 9.00 | 9.00 | 9.00 |
| 5 | 88 | 7.5 | 7.5 | 3.0 | 3.0 | 9.00 | 9.00 | 9.00 |
| Sum | 40.50 | 40.50 | 41.50 |
From the table:
- Σ(Rₓ − R̄ₓ)(Rᵧ − R̄ᵧ) = 40.5
- Σ(Rₓ − R̄ₓ)² = 40.5
- Σ(Rᵧ − R̄ᵧ)² = 41.5
Step 3: Apply the Formula
Substitute the values from Step 2 into the formula:
rₛ = 40.5 / √[(40.5)(41.5)]
= 40.5 / 40.9970
= 0.9879
Therefore, Spearman’s rank correlation coefficient, rₛ = 0.9879.
Step 4: Interpret the Result
The value rₛ = 0.9879 indicates a very strong positive monotonic correlation between class participation ratings and final project scores. Therefore, students with higher participation ratings generally tended to earn higher project scores.
How to Interpret Spearman’s Correlation Coefficient
Spearman’s rₛ ranges from −1 to +1. The sign tells you the direction of the relationship, while the absolute value tells you its strength.
This calculator uses the following guidelines:
| Absolute value of rₛ | Interpretation |
|---|---|
| 0.00 to 0.19 | Very weak |
| 0.20 to 0.39 | Weak |
| 0.40 to 0.59 | Moderate |
| 0.60 to 0.79 | Strong |
| 0.80 to 1.00 | Very strong |
For example:
- rₛ = 0.88 indicates a very strong positive monotonic correlation.
- rₛ = −0.73 indicates a strong negative monotonic correlation.
- rₛ = 0.46 indicates a moderate positive monotonic correlation.
- rₛ = −0.25 indicates a weak negative monotonic correlation.
These ranges provide a general guide rather than strict cutoffs. The importance of a correlation also depends on the subject area and the context of the data.
When Should You Use Spearman’s Correlation?
Spearman’s correlation is useful when you want to measure the strength and direction of a monotonic relationship using the order or ranks of the observations.
You may use Spearman correlation when:
- one or both variables are ordinal
- the observations are already given as ranks
- the relationship is monotonic but not linear
- the data contain extreme values that could strongly influence Pearson’s correlation
- the data do not meet the conditions needed for a meaningful Pearson correlation
Spearman vs Pearson Correlation
Spearman and Pearson correlation both measure the strength and direction of a relationship between two variables. However, they measure different types of relationships.
The table below shows the key differences between them.
| Spearman Correlation | Pearson Correlation |
|---|---|
| Measures a monotonic relationship | Measures a linear relationship |
| Uses ranks | Uses the original numerical values |
| Can be used with ordinal or ranked data | Generally used with quantitative data |
| Can describe curved monotonic relationships | Focuses on straight-line relationships |
| Reduces the influence of the magnitude of extreme values | Can be strongly affected by extreme values |
Still unsure which correlation coefficient to compute? Use Spearman correlation when the relationship follows a consistent increasing or decreasing pattern but does not necessarily form a straight line. However, if you have two quantitative variables and want to measure the strength and direction of their linear relationship, use Pearson correlation instead.
Frequently Asked Questions
A Spearman correlation coefficient calculator is an online tool that finds Spearman’s rank correlation coefficient, rₛ, from two sets of paired data. It ranks the observations and measures the strength and direction of the monotonic relationship between the variables.
When there are no tied ranks, Spearman’s correlation coefficient formula is: rₛ = 1 − 6Σd² / [n(n² − 1)], where d is the difference between the X and Y ranks and n is the number of paired observations. However, when ties occur, assign average ranks to the tied values and calculate Spearman’s correlation from the resulting ranks.
Yes. Spearman correlation is well suited to ordinal data because it uses the order of the observations rather than assuming equal distances between categories.
Yes. You can use Spearman correlation with continuous data when you want to measure a monotonic relationship rather than specifically a linear one.
No. Spearman correlation does not require the variables to follow a normal distribution.
No. Spearman correlation measures association between two variables. Even a value close to +1 or −1 does not prove that one variable causes changes in the other.
Spearman correlation is generally less sensitive to the magnitude of extreme observations than Pearson correlation because it uses ranks instead of the original values. However, this does not mean that outliers can never affect Spearman’s rₛ. An unusual observation can still change the ordering of the data or weaken the monotonic pattern.
