
One-Way ANOVA vs Two-Way ANOVA: What Is the Difference?
Analysis of variance, commonly abbreviated as ANOVA, is a statistical method used to determine whether the mean of a quantitative variable differs across groups. Rather than comparing every pair of means separately, ANOVA compares the variation explained by the groups with the variation that remains within the groups.
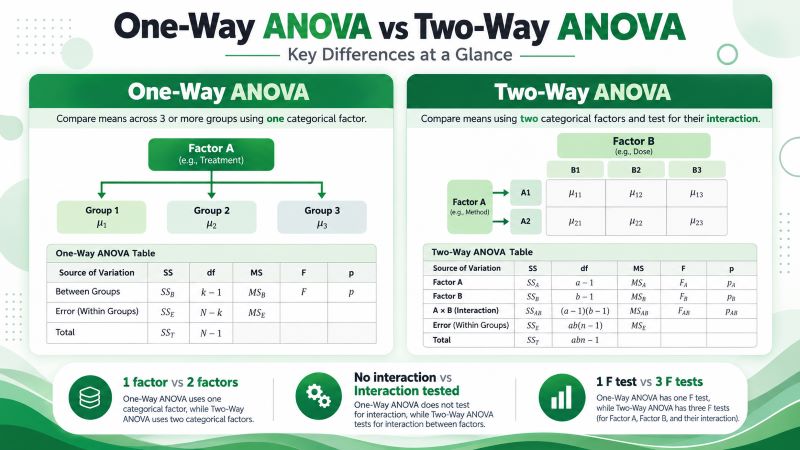
Two common forms of ANOVA are one-way ANOVA and two-way ANOVA. Both are used to compare means, and both have one quantitative dependent variable. However, they differ in the number of categorical independent variables, also called factors, included in the analysis.
A one-way ANOVA has one factor. On the other hand, a two-way ANOVA has two factors and can also test whether the effect of one factor changes depending on the level of the other factor.
In this guide, we compare one-way vs two-way ANOVA, explain their differences and similarities, and show how to determine which test is appropriate for your study.
One-Way ANOVA vs Two-Way ANOVA: Similarities and Differences
The table below summarizes the main similarities and differences between one-way and two-way ANOVA.
| Feature | One-Way ANOVA | Two-Way ANOVA |
|---|---|---|
| Number of factors | One categorical factor | Two categorical factors |
| Dependent variable | One quantitative variable | One quantitative variable |
| Main effects tested | One | Two |
| Interaction effect | Not tested | Tested |
| Main hypothesis tests | One overall factor test | Factor A, Factor B, and A × B interaction |
| Data structure | Groups formed by levels of one factor | Cells formed by combinations of two factors |
| ANOVA output | One main F statistic | Separate F statistics for both factors and their interaction |
| Statistical test used | F test | F tests |
| Independence assumption | Yes | Yes |
| Approximate normality | Yes | Yes |
| Homogeneity of variances | Yes | Yes |
| Follow-up analysis | Post hoc comparisons may be required | Pairwise or simple-effects comparisons may be required |
The main difference is the number of factors. However, adding a second factor changes more than the number of variables in the analysis. It also changes the hypotheses being tested, the way the data are organized, the ANOVA table, and how the results should be interpreted.
Let us look at these differences in more detail.
1. Number of Factors
The first difference between one-way and two-way ANOVA is the number of categorical independent variables included in the analysis. In ANOVA, a categorical independent variable is called a factor.
A one-way ANOVA contains one factor, while a two-way ANOVA contains two.
Suppose a warehouse manager wants to determine whether average order-picking time differs among three storage layouts:
- Zone storage
- Class-based storage
- Random storage
In this study:
- Storage layout is the factor.
- Order-picking time is the dependent variable.
Because there is only one categorical factor, a one-way ANOVA would be appropriate.
Now suppose the warehouse manager also wants to investigate whether the type of scanner used by employees affects picking time.
The study now contains:
- Factor A: Storage layout
- Factor B: Scanner type
- Dependent variable: Order-picking time
Because there are two categorical factors, a two-way ANOVA would be appropriate.
Factors Are Not the Same as Levels
A common mistake when choosing between one-way and two-way ANOVA is confusing factors with levels. A factor is the categorical variable being studied, while a level is one of its categories.
For example, storage layout is one factor with three levels:
- Zone
- Class-based
- Random
Although there are three groups, this is still a one-way ANOVA because all three groups belong to the same factor.
Suppose scanner type is then added with two levels:
- Handheld
- Wearable
The study now contains two factors (scanner type and storage layout), where scanner type has two levels whereas storage layout has 3 levels. This makes the question a two-way ANOVA problem. To be specific, it is a 2 x 3 two-way ANOVA or 2 x 3 factorial design.
Therefore, the terms one-way and two-way refer to the number of factors, not the number of groups.
A study with five groups can still be a one-way ANOVA if those groups are five levels of the same factor. Likewise, a study with two factors can be a two-way ANOVA even when each factor has only two levels.
For a more detailed explanation of studies with one factor, see our One-Way ANOVA guide.
2. Research Questions and Hypotheses
The number of factors also determines the questions the ANOVA can answer. A one-way ANOVA tests one overall factor effect, whereas a two-way ANOVA tests two main effects and an interaction effect.
One-Way ANOVA
Suppose the warehouse manager wants to compare order-picking time across Zone, Class-Based, and Random storage layouts.
The research question is: Is there a statistically significant difference in order-picking time among the three storage layouts?
In this case, the hypotheses are:
- Null Hypothesis, H₀: μ₁ = μ₂ = μ₃. In words, population means are equal
- Alternative hypothesis, H₁: At least one population mean differs.
Therefore, the one-way ANOVA produces one overall F test for the storage-layout factor. If the result is statistically significant, we conclude that there is sufficient evidence that the population means are not all equal.
However, the overall ANOVA does not tell us which specific storage layouts differ. If there are three or more groups and you want to determine which groups are statistically different, you may need to perform post hoc analysis.
Two-Way ANOVA
Now suppose the warehouse manager wants to examine both storage layout and scanner type. In this case, the research question would be:
Do storage layout and scanner type affect order-picking time, and does the effect of scanner type depend on the storage layout?
The analysis now contains three hypothesis tests. In particular, we need to test the two main effects, storage layout and scanner type, and the interaction between them.
The hypotheses are as follows.
Storage layout
- H₀A: Mean picking time does not differ among the storage layouts.
- H₁A: Mean picking time differs for at least one storage layout.
Scanner type
- H₀B: Mean picking time does not differ between the scanner types.
- H₁B: Mean picking time differs between the scanner types.
Storage Layout × Scanner Type interaction
- H₀AB: There is no interaction between storage layout and scanner type.
- H₁AB: There is an interaction between storage layout and scanner type.
The two main-effect hypotheses determine whether storage layout and scanner type are individually associated with mean picking time. The interaction hypothesis determines whether the effect of scanner type on picking time changes depending on the storage layout.
Therefore, a two-way ANOVA produces a separate F statistic and p-value for each of these three effects. In particular, we will have F-tests for Factor A, Factor B, and the interaction (Factor A x Factor B)
Want to see how these hypotheses are tested and how the F statistics are calculated manually? See our Two-Way ANOVA guide.
3. Interaction Effect
One of the most important differences between one-way and two-way ANOVA is that a two-way ANOVA can test an interaction effect. An interaction occurs when the effect of one factor changes depending on the level of the other factor.
Consider the following average order-picking times:
| Storage Layout | Handheld Scanner | Wearable Scanner |
|---|---|---|
| Zone | 16 minutes | 12 minutes |
| Class-Based | 14 minutes | 11 minutes |
| Random | 18 minutes | 18 minutes |
For Zone storage, switching from a handheld scanner to a wearable scanner reduces average picking time by 4 minutes since 16 − 12 = 4. Similarly, the difference for Class-based storage is 3 minutes (14-11), and that of Random storage is 0 minutes (18-18).
This implies that the effect of scanner type is different across the storage layouts. Notably, wearable scanners appear to reduce picking time under Zone and Class-Based storage, but they provide no apparent improvement under Random storage. However, we need to support these differences statistically. This is where a two-way ANOVA comes in. In this case, it helps us test whether this pattern is statistically significant. Employing a one-way ANOVA in this scenario would make it impossible to directly test for this interaction because it contains only one factor.
Why Does the Interaction Matter?
Suppose the overall results show that workers using wearable scanners have a lower average picking time than workers using handheld scanners.
If we considered only this overall result, we might conclude that wearable scanners improve picking efficiency. However, the cell means show that the benefit depends on the storage layout. The scanners appear useful for some layouts but not for others.
Therefore, if the interaction is statistically significant, simply reporting the overall scanner effect may give an incomplete picture. For this reason, the interaction is usually examined before the main effects when interpreting a two-way ANOVA.
4. Data Structure
One-way and two-way ANOVA also differ in how the observations are organized. In a one-way ANOVA, observations are divided according to the levels of one factor.
Below is an example of a one-way ANOVA dataset.
| Zone | Class-Based | Random |
|---|---|---|
| 15.2 | 12.8 | 17.3 |
| 14.7 | 13.1 | 18.2 |
| 15.6 | 12.5 | 16.9 |
| 14.9 | 13.4 | 17.6 |
Each column represents one level of the storage-layout factor. Therefore, performing a one-way ANOVA for the above data would help us test whether the mean picking time differs across these three groups.
However, in a two-way ANOVA, each observation belongs to a combination of two factor levels. The table below is an example dataset.
| Storage Layout | Scanner Type | Picking Time |
|---|---|---|
| Zone | Handheld | 16.1 |
| Zone | Wearable | 12.4 |
| Class-Based | Handheld | 14.2 |
| Class-Based | Wearable | 11.3 |
| Random | Handheld | 18.1 |
| Random | Wearable | 17.9 |
As you can see, each combination of storage layout and scanner type forms a cell. Storage layout has three levels, while scanner type has two. Therefore, the design contains: 3 × 2 = 6 cells. This is known as a 3 × 2 factorial design.
The two-way ANOVA keeps the two factors separate. This allows us to determine whether picking time is associated with storage layout, scanner type, or the combination of both.
5. ANOVA Table and Output
Because one-way and two-way ANOVA test different effects, their ANOVA tables are also different.
A one-way ANOVA divides the total variation into variation between the groups and variation within the groups. On the other hand, a two-way ANOVA divides the explained variation further into Factor A, Factor B, and the interaction between the two factors.
The formulas below show how these components are calculated.
One-Way ANOVA Table
For a one-way ANOVA, let:
- k = number of groups
- N = total number of observations
- SSB = between-groups sum of squares
- SSE = error sum of squares, also called the within-groups sum of squares
- SST = total sum of squares
Using these values, the one-way ANOVA table looks like follows.
| Source | Sum of Squares | df | Mean Square | F |
|---|---|---|---|---|
| Between Groups | SSB | k − 1 | MSB = SSB / (k − 1) | F = MSB / MSE |
| Error (Within Groups) | SSE | N − k | MSE = SSE / (N − k) | — |
| Total | SST | N − 1 | — | — |
Therefore, a one-way ANOVA produces one F statistic: F = MSB / MSE, which compares the variation among the group means with the unexplained variation within the groups.
For the complete formulas and a worked example, see our complete guide on how to perform a One-Way ANOVA by hand .
Two-Way ANOVA Table
A two-way ANOVA contains two factors. Therefore, the variation is separated into:
- Variation associated with Factor A, SSA
- Variation associated with Factor B, SSB
- Variation associated with the Factor A × Factor B interaction, SSAxB
- Unexplained or error variation.
For a balanced two-way ANOVA with replication, let:
- a = number of levels of Factor A
- b = number of levels of Factor B
- n = number of observations in each cell
- N = total number of observations = abn
- SSA = sum of squares for Factor A
- SSB = sum of squares for Factor B
- SSA×B = interaction sum of squares
- SST = total sum of squares
The two-way ANOVA table is then completed as follows:
| Source | Sum of Squares | df | Mean Square | F |
|---|---|---|---|---|
| Factor A | SSA | a − 1 | MSA = SSA / (a − 1) | FA = MSA / MSE |
| Factor B | SSB | b − 1 | MSB = SSB / (b − 1) | FB = MSB / MSE |
| A × B Interaction | SSA×B | (a − 1)(b − 1) | MSA×B = SSA×B / [(a − 1)(b − 1)] | FA×B = MSA×B / MSE |
| Error | SSE | ab(n − 1) | MSE = SSE / [ab(n − 1)] | — |
| Total | SST | abn − 1 | — | — |
From the table, it is now clear that while a one-way ANOVA produces one F-test, a two-way ANOVA produces three, which are:
- FA = MSA / MSE
- FB = MSB / MSE
- FA×B = MSA×B / MSE
Therefore, a two-way ANOVA can separately test the main effect of Factor A, the main effect of Factor B, and their interaction.
Want to perform either of these ANOVAs quickly? Use the ANOVA calculator.
6. Interpretation of the Results
The results of a one-way ANOVA are usually easier to interpret because there is one main factor test.
Suppose a one-way ANOVA gives: F(2, 42) = 6.84, p = .003. Since p < .05, we reject the null hypothesis and conclude that the result is statistically significant. Therefore, at the .05 significance level, there is sufficient evidence that mean order-picking time is not equal across all three storage layouts.
However, we still do not know which storage layouts differ. If necessary, we can examine post hoc comparisons.
On the other hand, a two-way ANOVA requires more careful interpretation because there are three effects.
Suppose the results are:
- Storage layout: p < .001
- Scanner type: p = .014
- Storage Layout × Scanner Type: p = .008
In this case, all three effects are statistically significant. However, we should first consider the interaction. Since the interaction is significant, the effect of scanner type changes depending on the storage layout.
Therefore, it would not be enough to report that wearable scanners reduce picking time overall. We would want to determine how the effect differs across the three storage layouts.
This is an important difference between one-way and two-way ANOVA. A two-way ANOVA is not simply two separate one-way ANOVAs combined. The interaction connects the two factors and can affect how their main effects should be interpreted.
7. Follow-Up Comparisons
Both one-way and two-way ANOVA may require additional comparisons after a statistically significant result. However, the type of follow-up analysis can differ.
For instance, suppose the one-way ANOVA shows that mean picking time differs among the three storage layouts. The result tells us that the three population means are not all equal. It does not tell us which specific layouts differ.
Therefore, we need to compare:
- Zone vs Class-Based
- Zone vs Random
- Class-Based vs Random
A post hoc test such as Tukey HSD can be used to compare these pairs while controlling for multiple testing.
However, with a two-way ANOVA, the follow-up analysis depends on which effect is statistically significant. If a main effect with three or more levels is significant and there is no important interaction, pairwise comparisons can be used to determine which levels differ.
However, when the interaction is statistically significant, simple effects are usually more informative.
For example, we may compare Handheld and Wearable scanners separately within:
- Zone storage
- Class-Based storage
- Random storage
These comparisons help us determine where the scanner effect changes.
Therefore, although both types of ANOVA may require follow-up tests, the two-way analysis often requires additional attention to the interaction.
Similarities Between One-Way and Two-Way ANOVA
Although one-way and two-way ANOVA differ in the number of factors they include, they are closely related statistical methods and share several important features. Below are some of their similarities.
1. Both Have One Quantitative Dependent Variable
Both tests examine differences in the mean of one quantitative dependent variable. In our warehouse example, the dependent variable is order-picking time. With one-way ANOVA, we may test whether picking time differs according to storage layout. However, with two-way ANOVA, we may test whether picking time differs according to storage layout and scanner type.
In both cases, there is still only one dependent variable (order-picking time). The difference is the number of categorical factors used to explain variation in that variable.
2. Both Use F Tests
Both one-way and two-way ANOVA use an F statistic to compare explained variation with unexplained variation. In a one-way ANOVA, one main F statistic is calculated for the factor, whereas three separate F-statistics are computed in a two-way ANOVA.
Although the number of F tests differs, the general principle is the same. A larger F statistic provides more evidence that the variation associated with an effect is large relative to the unexplained variation. The corresponding p-value is then used to make the statistical decision.
3. Both Use Categorical Factors
The factors included in ANOVA are categorical. For example, storage layout contains categories such as Zone, Class-Based, and Random. Similarly, scanner type contains categories such as Handheld and Wearable.
A one-way ANOVA includes one categorical factor, while a two-way ANOVA includes two.
4. Both Share the Main ANOVA Assumptions
The standard independent-groups versions of one-way and two-way ANOVA share the same main assumptions.
Independence of Observations
The observations should be independent. For example, one employee’s picking time should not determine another employee’s picking time.
If the same participants are measured repeatedly, an ordinary one-way or two-way ANOVA may not be appropriate. Instead, you may need to perform a repeated-measures or mixed ANOVA.
Approximate Normality
The residuals should be approximately normally distributed, particularly when the sample sizes are small. For one-way ANOVA, this relates to the groups formed by the single factor. However, for two-way ANOVA, the relevant groups are the cells formed by combinations of the two factors.
Homogeneity of Variances
The population variances should be reasonably similar across the groups being compared. For one-way ANOVA, this means the variances should be reasonably similar across the levels of the factor. For two-way ANOVA, the assumption applies across the cells formed by the combinations of both factors.
If the equal-variance assumption is violated in a one-way analysis, Welch’s ANOVA may be a more appropriate alternative.
5. Both May Require Follow-Up Comparisons
A statistically significant ANOVA does not always tell you exactly where the differences occur. After a significant one-way ANOVA, you may need to perform post hoc comparisons to determine which group means differ.
Similarly, a two-way ANOVA may require pairwise or simple-effects comparisons depending on which effects are statistically significant.
Therefore, in both analyses, the overall F test may only be the first stage of interpreting the results.
Conclusion
Although a one-way and two-way ANOVA compare means, they answer different research questions. A one-way ANOVA contains one categorical factor and determines whether the mean of a quantitative dependent variable differs across the levels of that factor. On the other hand, a two-way ANOVA contains two categorical factors. It tests the main effect of each factor and also determines whether the two factors interact. Despite these differences, both methods have one quantitative dependent variable, use F tests, and share the main ANOVA assumptions.
Therefore, when choosing between them, you should identify the number of factors in the research question. If your research question has one factor, a one-way ANOVA is appropriate. However, if there are two categorical factors, use a two-way ANOVA instead.
Already know which test to use but looking for a free online tool to perform the test? Use the ANOVA Calculator to perform either of two ANOVAs. You’ll get descriptive statistics, assumption checks, ANOVA tables, effect sizes, follow-up comparisons, interpretation, and an APA-formatted result.
Frequently Asked Questions
The main difference is the number of categorical factors included in the analysis. While a one-way ANOVA has one factor, a two-way ANOVA has two factors. Two-way ANOVA can also test whether the two factors interact.
Both methods have one quantitative dependent variable, compare means using F tests, and use categorical factors. The standard independent-groups versions also share the main assumptions of independent observations, approximate normality, and homogeneity of variances.
Yes. A one-way ANOVA can contain several levels of the same factor. For example, comparing average picking time across five warehouse layouts is still a one-way ANOVA because warehouse layout is the only factor.
Yes. Suppose Factor A has two levels and Factor B also has two levels. The factors form four combinations, resulting in a 2 × 2 factorial design. The data can be analyzed using a two-way ANOVA.
No. A standard two-way ANOVA has one quantitative dependent variable. The term “two-way” refers to the two categorical factors.
You should generally examine the interaction first. If the interaction is statistically significant, the effect of one factor depends on the level of the other factor. In this case, interpreting only the overall main effects may hide important differences.
