
One-Sample T-Test: Formula, Example & How to Calculate by Hand
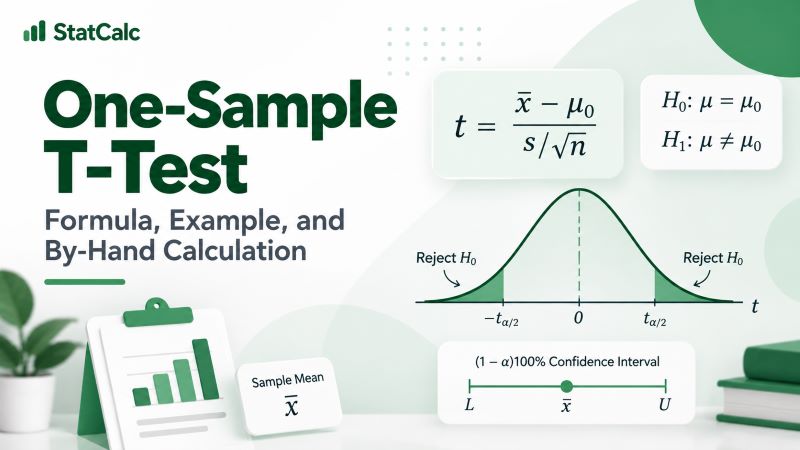
A one-sample t-test is a statistical hypothesis test used to determine whether the mean of one population differs significantly from a specified or hypothesized value. The test is commonly used when you have data from one sample and want to compare its mean with a known target, expected value, or population claim.
Unlike the one-sample z-test, which requires the population standard deviation to be known, a one-sample t-test assumes the population standard deviation(σ) is unknown and estimates it using the sample standard deviation (s).
In this guide, we explain how the one-sample t-test works, its hypotheses and assumptions, the formula used to calculate the test statistic, and how to perform the test by hand using a complete example.
Already have your data and need to perform the analysis and see the APA report? Use the One-Sample T-Test Calculator.
What Is a One-Sample T-Test?
A one-sample t-test, sometimes called a single-sample t-test or one-sample mean t-test, compares a sample mean with a hypothesized population mean.
Suppose μ₀ represents the population mean stated in a claim. We collect a sample and calculate its mean, x̄. The sample mean will rarely be exactly equal to μ₀ because samples naturally vary.
Therefore, the important question is not simply whether x̄ and μ₀ are different. Instead, the test asks whether the observed difference is large enough relative to the variability in the sample to provide evidence that the population mean differs from μ₀.
We do this by calculating a t statistic and finding how likely a value at least that extreme would be if the null hypothesis were true.
When to Use a One-Sample T-Test
Use a one-sample t-test when you want to compare the mean of one quantitative variable with a specified value and the population standard deviation is unknown.
For the test to be appropriate, you should have one sample from the population of interest, the outcome should be quantitative, and individual observations should be independent.
For example, a one-sample t-test may be used to determine whether the mean filling weight of a product differs from the value printed on its package, whether average examination scores differ from a specified benchmark, or whether the mean time required to complete a task differs from a target value.
The population standard deviation, σ, should be unknown. If σ is known, the corresponding procedure is a one-sample z-test.
A one-sample t-test is also not restricted to samples smaller than 30. It can still be used with large samples when the population standard deviation is unknown. As the sample size and degrees of freedom increase, the t distribution becomes increasingly similar to the standard normal distribution.
How Does a One-Sample T-Test Work?
The one-sample t-test looks at the difference between the observed sample mean and the hypothesized population mean. That difference is then divided by the estimated standard error of the sample mean.
In other words, the t statistic tells us how many estimated standard errors the sample mean is from the value stated in the null hypothesis.
A t statistic close to zero means the sample mean is close to the hypothesized value relative to the sampling variability. However, a large positive t statistic means the sample mean is substantially greater than the hypothesized value. On the other hand, a large negative t statistic means it is substantially lower.
Whether a particular t statistic provides enough evidence to reject the null hypothesis depends on the alternative hypothesis, degrees of freedom, and significance level.
One-Sample T-Test Hypotheses
The null hypothesis states that the population mean is equal to the hypothesized value: H₀: μ = μ₀
The alternative hypothesis depends on the research question. The table below summarizes the null and alternative hypotheses for a one-sample t-test, when the test is two-tailed, right-tailed, or left-tailed.
| Type of Test | Research Question | Null Hypothesis | Alternative Hypothesis |
|---|---|---|---|
| Two-tailed | Is the population mean different from μ₀? | H₀: μ = μ₀ | H₁: μ ≠ μ₀ |
| Right-tailed | Is the population mean greater than μ₀? | H₀: μ = μ₀ | H₁: μ > μ₀ |
| Left-tailed | Is the population mean less than μ₀? | H₀: μ = μ₀ | H₁: μ < μ₀ |
Note. You should determine the direction of the alternative hypothesis from the research question before examining the results. For example, if you only want to determine whether the population mean is different from 100, use a two-tailed test. However, if the research question specifically asks whether the population mean is greater than 100, you should use a right-tailed test. Similarly, use a left-tailed test if you want to determine whether the population mean is less than 100.
One-Sample T-Test Assumptions
Before performing a one-sample t-test, check whether your data meet the following conditions.
1. The dependent variable should be quantitative
The dependent/response variable should be numerical and measured on a scale for which calculating a mean is meaningful. Examples include weight, examination score, response time, temperature, height, and income.
2. Observations should be independent
Each observation should provide information that is independent of the other observations. For example, the measurement obtained from one participant should not determine or directly affect the measurement obtained from another participant.
When sampling without replacement from a finite population, a common guideline is that the population should be substantially larger than the sample.
3. The sample should be randomly selected or otherwise representative
Random sampling helps ensure that the sample provides reasonable information about the population to which you want to generalize the results. A t-test cannot correct problems caused by a severely biased sample.
4. The data should be approximately normally distributed when the sample is small
The one-sample t-test assumes that the underlying population is approximately normal. This assumption becomes particularly important with small samples. For larger samples, the sampling distribution of the mean becomes more nearly normal, making the t procedure more robust to moderate departures from normality.
However, severe skewness and extreme outliers can still be problematic, especially when the sample is small.
5. The population standard deviation should be unknown
A one-sample t-test estimates the population standard deviation using the sample standard deviation, s. If the population standard deviation, σ, is known, use a one-sample z-test instead.
One-Sample T-Test Formula
The test statistic formula for a one-sample t-test is:
t = (x̄ − μ₀) / (s / √n)
Where:
| Symbol | Meaning |
|---|---|
| t | One-sample t-test statistic |
| x̄ | Sample mean |
| μ₀ | Hypothesized population mean |
| s | Sample standard deviation |
| n | Sample size |
The denominator of the formula (s/√n) is the estimated standard error of the sample mean. Thus, SE = s / √n.
Therefore, the t-test formula can also be written as: t = (x̄ − μ₀) / SE
The numerator shows how far the sample mean is from the hypothesized mean, while the denominator shows the amount of sampling variability we would expect in the sample mean.
Degrees of Freedom for a One-Sample T-Test
The degrees of freedom for a one-sample t-test are: df = n − 1, where n is the sample size.
For example, if a study includes 25 observations, the degrees of freedom are: df = 25 − 1
= 24
The degrees of freedom determine the exact shape of the t distribution used to calculate the p-value and critical t value. Smaller degrees of freedom produce a t distribution with heavier tails. As the degrees of freedom increase, the t distribution approaches the standard normal distribution.
Want to quickly find the degrees of freedom for this test or any other test online? Use the degrees of freedom calculator.
How to Perform a One Sample T-Test by Hand
You can easily find the one-sample t-test by hand by using the 6 steps of hypothesis testing.
Example. A battery manufacturer claims that a new battery lasts more than 100 hours on average. A random sample of 16 batteries has a mean lifetime of 104 hours and a sample standard deviation of 8 hours. At the 0.05 significance level, is there enough evidence to support the manufacturer’s claim?
Solution
To conduct the test, follow these steps.
Step 1: State the hypotheses
The claim is that the average battery life is greater than 100 hours. Therefore, this is a right-tailed test.
This means we need to test the hypotheses:
- H0:μ = 100
- H1:μ > 100
Step 2: State the significance level
From the question, the significance level is α = 0.05
Step 3: Calculate the test statistic
By definition, the one-sample t-statistic formula is: t = (x̄-μ₀)/(s/√n)
From the question, we know that:
- Sample mean, x̄ = 104
- Hypothesized mean, μ₀ = 100
- Sample standard deviation, s = 8
- Sample size, n = 16
Substituting the values into the formula gives:
t = (104-100)/(8/√16)
= 4/2
= 2.00
Therefore, the one-sample t-test statistic is: t =2.00
Step 4: Find the p-value and Critical value
Using a t-score to p-value calculator or the p-value calculator, the right-tailed p-value is 0.031973. Additionally, the right-tailed critical value using the t-critical value calculator is: t0.05, 15 = 1.7531.
Recall. The degrees of freedom formula for a one-sample t-test is: df = n-1, where n is the sample size. In this case, df = 16-1 = 15.
Step 5: Make the decision
Since the p-value (0.031973) is less than the 0.05 significance level, we reject the null hypothesis. Also, using the critical value approach, we can see that the absolute test statistic value (2.00) is greater than the t-critical value (1.7531), which indicates we reject the null hypothesis.
Step 6: Write the conclusion
At the 0.05 significance level, there is enough evidence to conclude that the mean battery life is greater than 100 hours.
P-Value Method vs Critical-Value Method
There are two common ways to make the final decision in a one-sample t-test. With the p-value method, compare the p-value with α. If p ≤ α, we reject the null hypothesis, H₀. However, if p > α, we fail to reject the null hypothesis, H₀.
With the critical-value method, we compare the calculated t statistic with the appropriate critical t value and make the decisions as follows:
- Right-tailed test. Reject H₀ when the calculated t statistic is greater than the positive critical value.
- Left-tailed test. Reject H₀ when the calculated t statistic is less than the negative critical value.
- Two-tailed test. Reject H₀ when the test statistic falls beyond either critical value.
This distinction is important. You should not simply take the absolute value of t when performing a one-tailed test because the direction of the test statistic matters.
Both methods should produce the same statistical decision provided you apply them correctly.
One-Sample T-Test and Confidence Intervals
A confidence interval provides another way to interpret the result of a one-sample t-test. However, the confidence level should correspond to the type of hypothesis test being performed.
For a two-tailed test at α = 0.05, we normally use a 95% confidence interval. However, for a one-tailed test, we can obtain an equivalent two-tailed confidence interval by doubling the significance level.
In our battery example, the right-tailed test uses α = 0.05. Therefore, the equivalent two-tailed significance level is: 2(0.05) = 0.10
The corresponding confidence level is: 1 − 0.10 = 0.90. This means that for a right-tailed test at α = 0.05, we need to construct a 90% two-sided confidence interval.
From the example, given that:
- x̄ = 104
- s = 8
- n = 16
- df = 15
We can construct the 90% confidence interval as follows:
i) Calculate the standard error.
For a single mean, the standard error, SE = s / √n
Substituting the values gives:
= 8 / √16
= 2
ii) Find the critical value
For a 90% confidence interval with df = 15, the critical t value is t = 1.753*
iii) Calculate the confidence interval
The confidence interval is: CI = x̄ ± t(SE)*
= 104 ± 1.753(2)
= 104 ± 3.506
Therefore, 90% CI = [100.494, 107.506]
Since the hypothesized population mean of 100 hours falls below the lower limit of the interval, we reject the null hypothesis and conclude that the mean battery lifetime is greater than 100 hours. This is consistent with the hypothesis conclusion.
Effect Size for a One-Sample T-Test
Statistical significance tells us whether the evidence against the null hypothesis is strong enough, but it does not tell us how large the difference is. To examine how large this difference is, we need to compute the effect size.
For a one-sample t-test, we estimate the effect size using Cohen’s d. The formula is: d = (x̄ − μ₀) / s.
For the battery example, Cohen’s d = (104 − 100) / 8
= 4 / 8
= 0.50
The positive sign indicates that the sample mean is above the hypothesized mean.
A Cohen’s d of 0.50 means that the sample mean is half a standard deviation above the hypothesized value of 100 hours. Using the commonly cited guidelines, this would generally be described as a medium effect.
However, you should interpret effect size in the context of the research question. For a battery manufacturer, for example, an average increase of four hours may be more or less important depending on the intended use of the battery.
How to Report a One-Sample T-Test in APA
A complete report should normally identify the sample mean and standard deviation, the hypothesized value, t statistic, degrees of freedom, p-value, and the direction of the result.
For the battery example, we calculated:
- M = 104 hours
- SD = 8 hours
- μ₀ = 100 hours
- t = 2.00
- df = 15
- p = .032
- Cohen’s d = 0.50
Therefore, we can report the above results in APA as follows.
A one-sample t-test showed that the mean battery lifetime (M = 104.00 hours, SD = 8.00) was significantly greater than the hypothesized value of 100 hours, t(15) = 2.00, p = .032, Cohen’s d = 0.50.
If you also want to report the confidence interval, you can write: The 95% one-sided lower confidence bound for the population mean was 100.49 hours.
The statistical result should then be followed by a conclusion written in the context of the research question:
At the 0.05 significance level, there is sufficient evidence to support the manufacturer’s claim that the mean battery lifetime is greater than 100 hours.
One-Sample T-Test vs One-Sample Z-Test
The one-sample t-test and one-sample z-test answer a similar question. In particular, they both test whether a population mean differs from a specified value.
The main difference is whether the population standard deviation is known. The table below provides a quick summary of the key differences between a one-sample t-test and one-sample z test.
| Feature | One-Sample T-Test | One-Sample Z-Test |
|---|---|---|
| Number of samples | One | One |
| Compares sample mean with μ₀ | Yes | Yes |
| Population standard deviation | Unknown | Known |
| Standard deviation used | Sample SD, s | Population SD, σ |
| Reference distribution | t distribution | Standard normal distribution |
| Degrees of freedom | n − 1 | Not required |
Frequently Asked Questions
It is a statistical test used to determine whether the mean of a population differs from a specified value when the population standard deviation is unknown.
The test statistic formula is t = (x̄ − μ₀) / (s / √n), where x̄ is the sample mean, μ₀ is the hypothesized mean, s is the sample standard deviation, and n is the sample size.
The degrees of freedom are: df = n − 1. For example, a sample of 20 observations has 19 degrees of freedom.
Use a one-sample t-test when you have one quantitative sample, want to compare its population mean with a specified value, and do not know the population standard deviation.
Yes. You can use the one-sample t-test with large samples when the population standard deviation is unknown. It is not limited to samples smaller than 30.
Minor departures from normality are often less problematic with larger samples. However, severe skewness, influential outliers, dependence between observations, or biased sampling can make the results unreliable. For small samples with serious departures from normality, a suitable nonparametric procedure may be considered depending on the research question and data.
