
Descriptive vs. Inferential Statistics: Differences and Examples
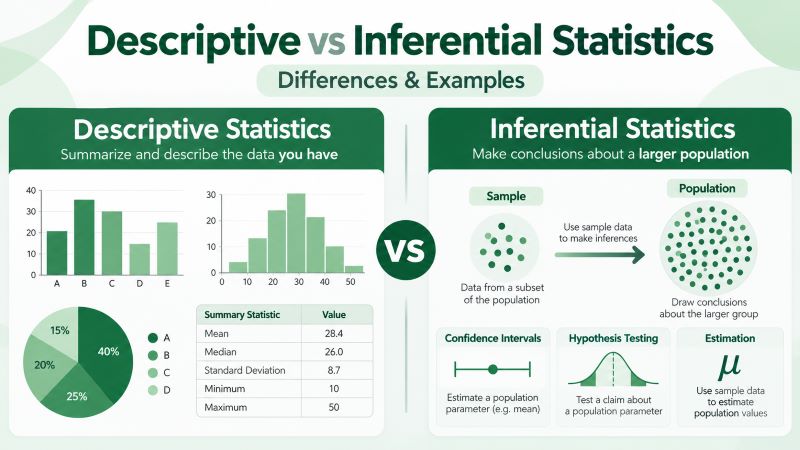
Statistics is broadly divided into two main branches: descriptive statistics and inferential statistics. Although both involve analyzing data, they serve different purposes. Descriptive statistics summarize and describe the data that has been collected, while inferential statistics use sample data to draw conclusions about a larger population.
For example, calculating the average exam score of 30 students in a class is descriptive statistics. However, using the scores of 30 randomly selected students to estimate the average score of all students in a school involves inferential statistics.
In this guide, we’ll explain both types of statistics, compare their differences, and use practical examples to help you understand when each is appropriate.
What Is Descriptive Statistics?
Descriptive statistics is the branch of statistics concerned with organizing, summarizing, and presenting data in a meaningful way.
Rather than looking at every observation individually, descriptive statistics helps us understand the main characteristics of a dataset using numerical measures, tables, and graphs.
For example, suppose a teacher records the following examination scores for five students: 65, 70, 75, 80, 90. The teacher can summarize these scores using the mean, median, range, and standard deviation.
From the data:
- Mean = 76
- Median = 75
- Minimum score = 65
- Maximum score = 90
- Range = 25
These statistics help us understand the performance of the five students without examining each score individually. However, they only describe the students whose scores were recorded. We cannot automatically conclude that the average score of other students is also 76.
Types of Descriptive Statistics
Descriptive statistics can be grouped into several categories depending on the characteristics of the data being summarized.
1. Measures of central tendency
These measures describe the center or typical value of a dataset. The most common are:
- Mean: The arithmetic average of the observations.
- Median: The middle value when observations are arranged in order.
- Mode: The most frequently occurring value.
2. Measures of dispersion
Measures of dispersion describe how spread out the observations are. Common examples include the range, variance, standard deviation, and interquartile range (IQR).
For instance, two classes might have the same mean examination score but different standard deviations. This indicates that although their average performance is similar, the scores vary by different amounts.
3. Measures of position
These measures describe where a particular observation falls within a dataset. They include quartiles, percentiles, and z-scores.
4. Tables and graphs
Descriptive statistics can also be presented visually using frequency tables, histograms, bar charts, box plots, and other graphs.
Graphs are especially useful for identifying patterns, comparing groups, and understanding the shape of a distribution.
If you have a dataset that you want to summarize, our Descriptive Statistics Calculator can help you find measures of center, spread, position, and other summary statistics.
What Is Inferential Statistics?
Inferential statistics is the branch of statistics that uses sample data to make estimates, test hypotheses, or draw conclusions about a larger population.
In most situations, collecting data from every member of a population is expensive, time-consuming, or impractical. Instead, researchers collect data from a sample and use statistical methods to learn about the population.
For example, suppose a university has 10,000 students and wants to estimate how many hours its students spend studying each week. Rather than surveying all 10,000 students, the university randomly selects 200 students.
Now, suppose the sample has a mean study time of 14 hours per week. The university can use this sample mean to estimate the average weekly study time of all 10,000 students.
However, the sample mean might not be exactly equal to the population mean. A different random sample could produce a slightly different result.
Inferential statistics accounts for this uncertainty using probability-based methods.
Types of Inferential Statistics
Inferential statistics mainly involves estimation and hypothesis testing.
1. Estimation
Estimation involves using sample statistics to estimate unknown population parameters.
For example, a researcher might use the mean income of 500 randomly selected households to estimate the average income of all households in a city.
Two common estimation approaches are:
- Point estimation: Uses a single value, such as a sample mean, to estimate a population parameter.
- Interval estimation: Uses a range of values, such as a confidence interval, to estimate a population parameter while accounting for sampling uncertainty.
For instance, a 95% confidence interval of (12.5, 15.5) hours provides a range of plausible values for the population mean study time under the statistical model. The 95% confidence level refers to the long-run coverage of the interval procedure.
2. Hypothesis testing
Hypothesis testing involves using sample data to evaluate a claim about a population.
Suppose a manufacturer claims that its batteries last 100 hours on average. A researcher might select a random sample of batteries to test whether the population mean battery life differs from 100 hours.
Common hypothesis tests include:
- Z-tests
- T-tests
- Chi-square tests
- Analysis of variance (ANOVA)
- Correlation and regression significance tests
The appropriate test depends on the research question, type of data, and assumptions of the statistical method.
For example, when testing a population mean with an unknown population standard deviation, you may use our One Sample T Test Calculator, provided the required conditions are satisfied.
Descriptive vs Inferential Statistics: Key Differences
The main difference between descriptive and inferential statistics is what we do with the data. Descriptive statistics helps us summarize the data we have collected, while inferential statistics allows us to use sample data to make conclusions about a larger population.
For example, suppose a researcher collects examination scores from 50 students. Calculating the mean and standard deviation of these scores is descriptive statistics. However, if the researcher uses the sample mean to estimate the average examination score of all students in the school, that would be inferential statistics.
The table below summarizes the key differences.
| Feature | Descriptive Statistics | Inferential Statistics |
|---|---|---|
| Purpose | Summarizes and describes data | Uses sample data to draw conclusions about a population |
| Data | Works with the data collected | Usually uses sample data |
| Common methods | Mean, median, standard deviation, tables, and graphs | Confidence intervals and hypothesis tests |
| Uncertainty | Describes the observed data without accounting for sampling uncertainty | Accounts for sampling uncertainty |
| Example | The mean score of 50 students is 75 | The mean score of all students is estimated to be 75 |
Notice that both types of statistics can be used on the same dataset. What matters is whether we are simply describing the observations or using them to make conclusions about a larger population.
Examples of Descriptive and Inferential Statistics
Let’s look at three examples to help us understand the difference between descriptive and inferential statistics.
Example 1. Descriptive Statistics
A teacher records the examination scores of all 40 students in a mathematics class and finds that the mean score is 74.
Is this an example of descriptive or inferential statistics?
Solution
This is descriptive statistics because the teacher is only reporting the average score of the 40 students in the class. No attempt is made to estimate the performance of students outside this class.
Example 2. Inferential Statistics
A college has 5,000 students. A researcher randomly selects 150 students and asks whether they prefer online or face-to-face classes. The researcher then uses their responses to estimate the proportion of all students who prefer online classes.
Is this descriptive or inferential statistics?
Solution
This is inferential statistics because the researcher is using responses from 150 students to estimate the preferences of all 5,000 students.
The 150 students represent a sample, while all 5,000 students make up the population of interest.
Example 3. Both Descriptive and Inferential Statistics
A researcher randomly selects 100 households from a city and collects information about their monthly electricity bills. The analysis gives the following results:
- Sample mean = $120
- Sample standard deviation = $25
- 95% confidence interval for the population mean = ($115, $125)
Identify the descriptive and inferential statistics.
Solution
The sample mean of $120 and standard deviation of $25 are descriptive statistics because they summarize the electricity bills of the 100 households surveyed.
On the other hand, the 95% confidence interval of ($115, $125) is inferential statistics because it is used to estimate the mean electricity bill of all households in the city.
Therefore, this study uses both descriptive and inferential statistics.
When Should You Use Descriptive or Inferential Statistics?
Whether to use descriptive or inferential statistics depends on the purpose of your analysis.
If you only want to summarize the data you have collected, descriptive statistics is sufficient. For example, suppose you have the examination scores of 30 students and want to find their average score, highest score, or standard deviation. You can obtain these results using descriptive statistics without performing any hypothesis tests.
However, if you want to use the scores of those 30 students to estimate the average score of all students in a school, you would need inferential statistics.
Similarly, if you want to test whether students who attend extra tutoring sessions perform better than those who do not, you may need to conduct a hypothesis test, such as an independent samples t-test.
One thing to keep in mind is that inferential statistics requires us to consider how the data was collected. For example, a sample that does not represent the population can produce misleading conclusions, even when the sample size is large.
How to Identify Descriptive and Inferential Statistics in Exam Questions
In statistics exams, you may be asked to identify whether a statement describes descriptive or inferential statistics.
To answer such questions, first identify what the researcher is doing with the data. Are they simply summarizing the observations, or are they using the data to estimate or test something about a larger population?
Consider the following examples.
| Statement | Type of Statistics |
|---|---|
| The average height of 25 students is 168 cm. | Descriptive |
| A sample of 300 voters is used to estimate the proportion of voters supporting a candidate in a state. | Inferential |
| A company reports that 60% of its employees work remotely. | Descriptive |
| A researcher uses a sample to test whether the population mean weight differs from 70 kg. | Inferential |
| The standard deviation of the examination scores of 40 students is 12. | Descriptive |
| A researcher constructs a 95% confidence interval for the proportion of adults who exercise regularly. | Inferential |
As you can see, questions involving averages, percentages, or standard deviations are often descriptive when they only summarize the observations.
However, if the question involves estimating an unknown population parameter or testing a claim about a population, it falls under inferential statistics.
Remember: The presence of a sample does not automatically make an analysis inferential. For example, calculating the mean of a sample is descriptive statistics. It becomes inferential when we use that mean to estimate the population mean.
Frequently Asked Questions
Descriptive statistics summarizes the data that has been collected, while inferential statistics uses sample data to make estimates or test hypotheses about a larger population.
Five common examples are the mean, median, mode, variance, and standard deviation. These statistics help us understand the center and spread of a dataset.
Examples include estimating a population mean using a sample, constructing confidence intervals, conducting t-tests, performing chi-square tests, and using ANOVA to compare population means.
Standard deviation is a descriptive statistic because it measures how spread out the observations are. However, the sample standard deviation can also be used in inferential statistics when calculating confidence intervals or performing hypothesis tests.
Yes. In fact, researchers commonly use both. They first summarize their data using descriptive statistics, such as the mean and standard deviation, before performing hypothesis tests or constructing confidence intervals.
Regression can be used for both. For example, fitting a regression line to describe the relationship between two variables in a dataset is descriptive. However, testing whether the population regression slope differs from zero involves inferential statistics.
