
Parameter vs Statistic: Differences with Examples
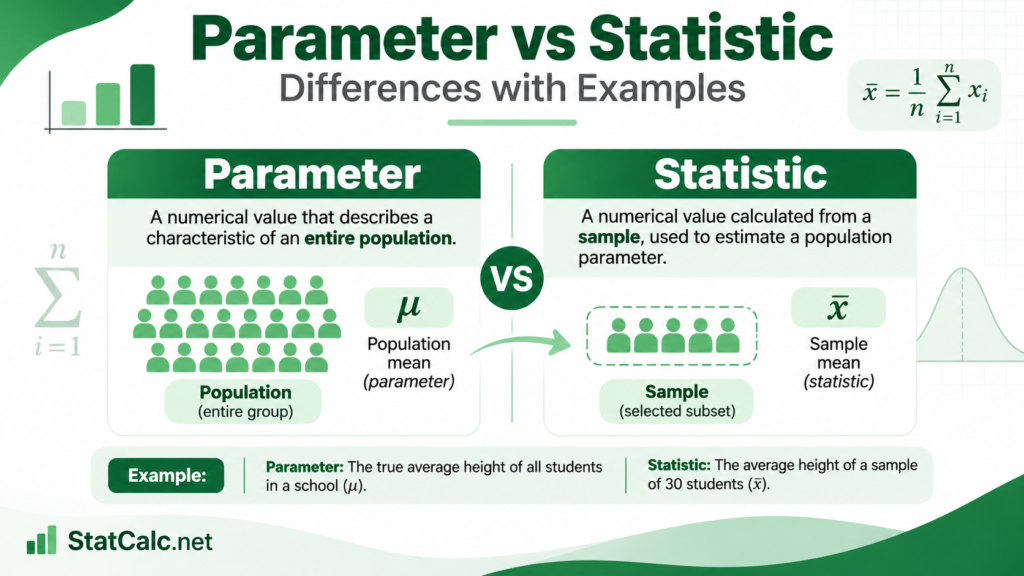
In statistics, a parameter is a numerical value that describes a population, while a statistic is a numerical value that describes a sample. For example, suppose the average height of all 8,000 students at a university is 168.5 cm. Since this value describes the entire population, it is a parameter. However, if 300 students are selected from the university and their average height is 169.2 cm, this sample mean is a statistic.
Parameters and statistics can describe the same characteristic, such as a mean, proportion, standard deviation, or variance. What determines whether a value is a parameter or statistic is the group from which it was obtained.
In this guide, we compare a parameter vs statistic, discuss their main differences and similarities, show the symbols commonly used for each, and explain how sample statistics are used to estimate population parameters.
Parameter vs Statistic: Key Differences
The table below summarizes the main differences between a parameter and a statistic.
| Feature | Parameter | Statistic |
|---|---|---|
| Meaning | Numerical value that describes a population | Numerical value that describes a sample |
| Group described | Population | Sample |
| Value | Fixed for a defined population | Can vary from one sample to another |
| Availability | Often unknown | Calculated from observed sample data |
| Common notation | Often Greek letters | Usually Roman letters or symbols with hats/bars |
| Examples | μ, σ, σ², p, ρ | x̄, s, s², p̂, r |
| Main purpose | Describes a population characteristic | Describes a sample and can estimate a parameter |
| Statistical inference | Usually the value researchers want to learn about | Provides the sample information used to make inferences |
Therefore, the main difference is the group being described. A parameter summarizes a population, whereas a statistic summarizes a sample.
However, the distinction also affects whether the value is fixed or varies between samples, the symbols used, and the role that the value plays in statistical inference. Each of these differences is discussed below.
1. Meaning
A parameter is a numerical value that summarizes a characteristic of an entire population. On the other hand, a statistic is a numerical value that summarizes the same or another characteristic using data from a sample.
Suppose a company employs 4,000 workers. If the average age of all 4,000 employees is 36.8 years, this value is a parameter because it describes the complete population.
However, suppose a researcher selects 200 employees and finds that their average age is 37.4 years. The value 37.4 is a statistic because it was calculated from a sample.
Both values describe the mean age. The difference is not the type of calculation being performed, but the group included in that calculation.
Therefore, a parameter is a numerical measure of a population, whereas a statistic is a numerical measure of a sample.
This relationship becomes easier to understand once you are clear about the difference between a population and sample. See our Population vs Sample guide for a detailed comparison.
2. Group Described
A parameter describes a population, while a statistic describes a sample drawn from that population.
For example, suppose a university wants to estimate how much its students spend on textbooks each semester. The university has 15,000 students. If the average amount spent by all 15,000 students were known, that average would be a population parameter.
However, if 500 students are surveyed and their average expenditure is calculated, the resulting value is a sample statistic.
This relationship can be written as:
- Population → Parameter
- Sample → Statistic
The population and sample must therefore be identified before deciding whether a numerical value is a parameter or statistic.
Tip. A number is not a parameter simply because it is large, and it is not a statistic because it is small. What matters is whether the value summarizes the entire population of interest or only a sample from it.
3. Value
For a particular population, a parameter has one fixed value. However, a statistic can change depending on the sample selected.
For example, suppose the true average weight of all packages produced by a factory today is 2.50 kg. In this case, the population mean is μ = 2.50 kg. This value is fixed for that population of packages.
Now suppose an inspector repeatedly selects random samples of 50 packages. The first sample might have a mean of 2.48 kg, while another could have a mean of 2.53 kg. These sample means are statistics, and they differ because each sample contains different packages.
Therefore, a parameter does not change simply because another sample is selected. However, a statistic can change from sample to sample.
This variation is known as sampling variability and is one reason why a sample statistic is rarely exactly equal to the population parameter it estimates.
4. Availability
Population parameters are often unknown because obtaining information from every member of a population may be difficult, expensive, or impossible. Sample statistics, on the other hand, can be calculated directly once the sample data have been collected.
Suppose a researcher wants to know the average weekly working hours of all nurses in a country. The true population mean, μ, exists, but determining it exactly would require obtaining information from every nurse in the population. In practice, this value may remain unknown. Instead, the researcher could select 1,000 nurses and calculate their sample mean, x̄.
The statistic is known because it can be calculated from the observed sample. The unknown population parameter can then be estimated using this statistic.
However, parameters are not always unknown. If data are collected from every member of a small population, the parameter can be calculated directly.
Therefore, it is more accurate to say that population parameters are often unknown, rather than always unknown.
5. Common Notation
Another difference between parameters and statistics is the notation used to represent them.
The table below shows the symbols you will commonly come across in statistics.
| Measure | Population Parameter | Sample Statistic |
|---|---|---|
| Mean | μ | x̄ |
| Standard deviation | σ | s |
| Variance | σ² | s² |
| Proportion | p | p̂ |
| Correlation | ρ | r |
| Size | N | n |
For example, μ represents the population mean, while x̄ represents the sample mean. Similarly, σ is used for the population standard deviation, whereas s is used for the sample standard deviation.
You will notice that several population parameters use Greek letters, such as μ, σ, and ρ. However, this is not always the case. Population proportion is represented by p, while population size is represented by N.
For sample statistics, symbols such as x̄, s, p̂, and r are commonly used.
Therefore, when you come across a statistical symbol, the notation can often help you determine whether the value refers to a population or a sample.
6. Examples
Parameters and statistics can describe many of the same characteristics. Common examples include means, proportions, variances, standard deviations, and correlations.
For example:
- Population mean (μ). The average income of all households in a city.
- Sample mean (x̄). The average income of 500 households selected from that city.
- Population standard deviation (σ). The standard deviation of the heights of all students at a school.
- Sample standard deviation (s). The standard deviation of the heights of 100 selected students.
- Population proportion (p). The proportion of all customers who are satisfied with a service.
- Sample proportion (p̂). The proportion of 800 surveyed customers who are satisfied.
- Population correlation (ρ). The correlation between height and weight for every person in the population.
- Sample correlation (r). The correlation calculated from a sample of people.
Therefore, the type of measure can be the same. What changes is whether it describes a population or sample.
7. Main Purpose
A parameter and statistic also serve different purposes in a statistical study. A parameter describes the characteristic researchers ultimately want to know about the population, while a statistic summarizes the observed sample and can be used to estimate that parameter.
For instance, suppose a researcher wants to know the average examination score of all Grade 12 students in a school district. The population mean, μ, is the parameter of interest. If collecting scores from every Grade 12 student is not practical, the researcher may select a sample and calculate its mean, x̄. In this case, the sample mean serves two purposes. It describes the students who were actually sampled, and it provides an estimate of the unknown population mean.
This is why statistics are particularly important when populations are too large to measure completely. In many research studies, the parameter is what we want to know, while the statistic is what we can calculate from the available data.
8. Statistical Inference
The relationship between parameters and statistics forms the basis of statistical inference. Researchers often want to make conclusions about population parameters but only have data from a sample. As such, they calculate sample statistics and use them to estimate or test claims about the population.
For example, suppose 400 employees have an average job satisfaction score of x̄ = 7.4. The sample mean of 7.4 is a statistic. It can be used as a point estimate of the unknown population mean, μ.
However, another sample could produce a slightly different mean. For this reason, researchers usually account for sampling uncertainty rather than assuming that x̄ is exactly equal to μ.
Parameter vs Statistic Examples
The examples below show how the same type of numerical measure can be either a parameter or a statistic depending on the group it describes.
| Scenario | Parameter | Statistic |
|---|---|---|
| Student height | Mean height of all students at a university | Mean height of 300 selected students |
| Household income | Median income of all households in a city | Median income of 500 sampled households |
| Customer satisfaction | Proportion of all customers who are satisfied | Proportion of 1,000 surveyed customers who are satisfied |
| Product weight | Standard deviation of all packages produced during a shift | Standard deviation of 100 inspected packages |
| Exam scores | Mean score of all Grade 10 students in a district | Mean score of 250 selected Grade 10 students |
| Height and weight | Correlation for everyone in the population | Correlation calculated from a sample |
As shown in the table, the type of quantity does not determine whether it is a parameter or statistic. A mean, proportion, standard deviation, or correlation can be either one. The distinction depends on whether the value describes the entire population or a sample.
Similarities Between a Parameter and a Statistic
Although parameters and statistics serve different roles, they also have several similarities.
Some of their main similarities include:
- Both are numerical summaries. A parameter and a statistic each describe a characteristic of a group using a numerical value.
- Both can describe the same characteristic. For example, both can represent a mean, proportion, variance, standard deviation, median, or correlation.
- Both depend on a clearly defined group. To know whether a number is a parameter or statistic, you must first identify the population and determine whether the value was calculated from all members or only a sample.
- Both are used in statistical analysis. Parameters describe populations, while statistics summarize samples and provide information that can be used to estimate those parameters.
Therefore, a statistic is not a different type of mathematical quantity from a parameter. The distinction comes mainly from where the value comes from and what group it describes.
How to Identify a Parameter or Statistic
When you are given a statistics question, you can usually identify the value by first asking which group it describes. If the number describes every member of the population of interest, it is a parameter. However, if the number was calculated from only a sample of that population, it is a statistic.
Consider the following example:
A university has 20,000 students. A random sample of 600 students reports an average weekly study time of 14.2 hours.
The value 14.2 hours is a statistic because it was calculated from the 600 sampled students rather than all 20,000 students.
However, do not rely on this memory aid alone. Always identify the population first and determine whether the numerical value describes the complete population or only a sample.
Can the Same Number Be a Parameter and a Statistic?
Yes. Whether a numerical value is a parameter or statistic depends on the group it is intended to describe.
For example, suppose the mean examination score for all 25 students in one statistics class is 78. If the question only concerns those 25 students, the value 78 is a parameter because it describes the entire population of interest. However, suppose the same class is being used as a sample to study all first-year statistics students at the university. The mean of 78 is now a statistic because it describes only a sample from that larger population.
Therefore, the calculation itself does not determine whether a value is a parameter or statistic. You must first define the population to which the research question applies. Once the population is clear, determine whether the numerical value describes the entire population or only a subset of it.
How Are Statistics Used to Estimate Parameters?
Since population parameters are often unknown, researchers use sample statistics to estimate them. There are two common approaches: point estimation and interval estimation.
A point estimate uses a single sample statistic as an estimate of the population parameter. For example, if a sample has a mean of 72.5, then x̄ = 72.5 can be used as a point estimate of μ.
An interval estimate provides a range of plausible values for the population parameter. For example, instead of estimating that the population mean is exactly 72.5, a 95% confidence interval might estimate that μ lies between 70.8 and 74.2. The interval acknowledges that another random sample could produce a different statistic.
For this reason, reporting a sample statistic together with a measure of uncertainty often provides more useful information than reporting the statistic alone.
The accuracy of the estimate also depends on factors such as the sample size, variability in the data, and how well the sample represents the population.
Why Does the Difference Between a Parameter and Statistic Matter?
Knowing whether a value is a parameter or statistic helps you interpret statistical results correctly. If a value is a parameter, it directly describes the defined population. However, if it is a statistic, it describes the observed sample and may be used to make a conclusion about a larger population.
The distinction also determines which symbols and formulas should be used. For example, μ and σ describe population characteristics, whereas x̄ and s describe sample characteristics.
More importantly, statistical inference is usually concerned with parameters. Confidence intervals estimate population parameters, while hypothesis tests evaluate claims about them using information calculated from samples.
For example, a one-sample t-test may use x̄ and s from a sample to test a claim about the population mean μ.
Understanding this relationship therefore makes it easier to interpret many of the formulas and symbols used later in statistics.
Frequently Asked Questions
A parameter is a numerical value that describes an entire population, while a statistic is a numerical value calculated from a sample. For example, μ is the population mean and is a parameter, while x̄ is the sample mean and is a statistic.
A mean can be either. The population mean, μ, is a parameter because it describes the entire population. The sample mean, x̄, is a statistic because it is calculated from a sample.
Population standard deviation, σ, is a parameter, while sample standard deviation, s, is a statistic. Which one applies depends on whether the data represent the entire population or only a sample.
A parameter describes one fixed population. Thus, its value remains the same as long as the population does not change. On the other hand, a statistic depends on which observations are included in a sample. As such, different samples can produce different values.
Yes. A sample statistic can happen to equal the population parameter exactly. However, this is not guaranteed, and statistics generally vary from one random sample to another.
No. Parameters are often unknown because collecting data from an entire population may be impractical. However, if every member of a defined population is measured, the parameter can be calculated directly.
