
Population vs Sample: What’s the Difference in Statistics?
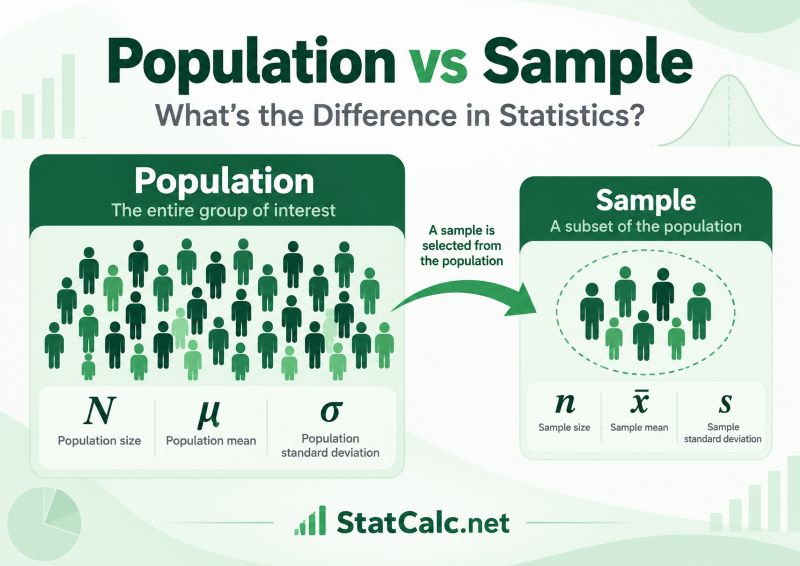
In statistics, a population is the entire group you want to study, while a sample is a smaller group selected from that population.
For example, suppose a university wants to determine the average amount students spend on textbooks each semester. If the university has 12,000 students, all 12,000 students form the population. If 500 students are selected and surveyed, those 500 students form the sample.
The distinction is important because population values and sample values are described using different terms and symbols. In addition, researchers often use statistics calculated from a sample to estimate unknown characteristics of a population.
In this guide, we compare a population vs sample in statistics, discuss each of their main differences, explain their similarities, and show how to identify the population and sample in practical examples.
Population vs Sample: Key Differences
The table below summarizes the main differences between a population and a sample.
| Feature | Population | Sample |
|---|---|---|
| Meaning | Entire group of interest | Part of the population selected for study |
| Main purpose | Group you want to describe or draw conclusions about | Provides data used to study the population |
| Size | Contains all members of the group of interest | Contains some members of the population |
| Size symbol | N | n |
| Numerical measure | Parameter | Statistic |
| Mean | μ | x̄ |
| Standard deviation | σ | s |
| Variance | σ² | s² |
| Proportion | p | p̂ |
| Sampling error | Does not arise from sampling when the whole population is measured | May occur |
| Statistical inference | Usually not required to describe the observed population | Often used to draw conclusions about the population |
The main difference is that a population contains the complete group you want to study, while a sample contains only part of that group.
However, this difference affects more than the number of observations. It also determines the symbols used, how numerical values are described, which formulas are applied, and how much uncertainty is involved in the results.
Each of these differences is discussed below.
1. Meaning
A population is the complete group of people, objects, events, or measurements that you want to study. On the other hand, a sample is a smaller group selected from that population.
Suppose a school district has 5,000 Grade 10 students and wants to determine their average mathematics score. In this case, all 5,000 Grade 10 students form the population. However, if the researchers select 400 students and collect their mathematics scores, those 400 students form the sample. The same idea applies when the observations are not people. For example, a manufacturer may be interested in all light bulbs produced during a month but inspect only 200 of them. The 200 bulbs form a sample.
Therefore, a population represents the entire group of interest, while a sample contains only the observations selected from that group.
However, the group considered to be the population depends on the research question. The population is the group you ultimately want to draw conclusions about, while the sample is the smaller group from which data are actually collected.
2. Main Purpose
The population and sample also serve different purposes in a statistical study. The population is the group the researcher ultimately wants to understand. However, the sample provides the data used to learn about that population when studying every member is not practical.
For example, suppose a company wants to know the average satisfaction level of all 20,000 customers who purchased a product during the year. The company may be interested in all 20,000 customers, but collecting information from every customer may take too much time and money. Instead, it could survey 1,000 customers.
The 20,000 customers form the population because this is the group the company wants to understand. On the other hand, the 1,000 surveyed customers form the sample because their responses are used to learn about the larger group.
Therefore, the population defines where you want the conclusion to apply, while the sample provides the observations used to reach that conclusion.
3. Size
A population contains all members of the group of interest, while a sample contains only some of them.
For example, suppose a university has 15,000 students. If the research question concerns all students at the university, the population size is 15,000. However, if 600 students are selected for a survey, the sample size is 600.
From the example, we see that a sample is usually smaller than the population from which it is selected. However, there is no fixed percentage of the population that a sample must contain.
The appropriate sample size depends on several factors, including the required level of precision, variability in the population, confidence level, and the type of analysis being performed. A larger sample generally provides more precise estimates, but sample size alone does not guarantee that the sample represents the population well.
Need to determine how many observations to collect for your study? Use our Sample Size Calculator.
4. Size Symbol
Population and sample sizes are represented using different symbols. The size of a population is usually denoted using an uppercase N, while the sample size is represented using a lowercase n.
For example, suppose a school has 2,500 students and a researcher selects 200 students for a study.
We can write:
- N = 2,500
- n = 200
Here, N represents the total number of students in the population, while n represents the number of students included in the sample.
This notation becomes useful when working with statistical formulas because it immediately shows whether a calculation refers to the population or the sample. You will often see N used in population formulas and n used in sample formulas throughout statistics.
5. Numerical Measure
A numerical value that describes a population is called a parameter, while a numerical value calculated from a sample is called a statistic.
For instance, suppose the average height of all 2,000 students at a college is 168.2 cm. Since this value describes the entire population, 168.2 cm is a population parameter.
Now suppose 100 students are selected from the college, and their average height is 169.1 cm. Since 169.1 cm was calculated from a sample, it is a sample statistic.
This distinction is important because population parameters are often unknown. Therefore, researchers calculate sample statistics and use them to estimate the corresponding population parameters.
Examples of a sample statistic include using a sample mean to estimate a population mean or a sample proportion to estimate a population proportion. In this case, the sample mean and sample proportion are the statistics, whereas the population mean and population proportion are the parameters.
6. Mean
The population and sample means describe the average value, but they use different symbols. The population mean is represented by μ, while the sample mean is represented by x̄.
The formulas are:
- Population mean: μ = Σx / N
- Sample mean: x̄ = Σx / n
Suppose all 40 employees in a small company have an average monthly salary of $4,200. Since all employees are included, μ = $4,200. However, if a larger company selects 100 employees and their average salary is $4,350, the result is a sample mean (i.e., x̄ = $4,350).
The calculation is essentially the same in both cases. The important difference is what the value represents. The population mean describes the complete population, while the sample mean describes only the observations included in the sample.
In inferential statistics, x̄ is commonly used to estimate the unknown population mean μ.
Want to instantly compute population means or sample means and compare their differences? Use the Mean Calculator.
7. Standard Deviation
Standard deviation measures how much the observations vary around the mean. The population standard deviation is represented by σ, while the sample standard deviation is represented by s.
Unlike the mean, the formulas for population and sample standard deviation are slightly different. The population formula uses all observations in the population and divides the sum of squared deviations by N, whereas the sample formula divides by n − 1.
The population standard deviation formula is:
σ = √[Σ(x − μ)² / N]
where:
- σ is the population standard deviation.
- x is each value in the population.
- μ is the population mean.
- N is the population size.
On the other hand, the sample standard deviation is:
s = √[Σ(x − x̄)² / (n − 1)]
where:
- s is the sample standard deviation.
- x is each value in the sample.
- x̄ is the sample mean.
- n is the sample size.
As you can see, the main difference between the two formulas is the denominator. Population standard deviation divides by N, while sample standard deviation divides by n − 1.
Using n − 1 helps correct the tendency of a sample to underestimate the variability in the population when the sample mean is used to estimate the unknown population mean.
Therefore, if your data include every member of the population you want to describe, use the population standard deviation formula. However, if the observations are a sample from a larger population, use the sample standard deviation formula.
Want to quickly compute either sample or population standard deviation online? Use the Standard Deviation Calculator to get instant results with a clear, step-by-step solution.
8. Variance
Variance measures the spread of values around the mean using squared deviations. It is closely related to standard deviation because the variance is simply the square of the standard deviation.
For a population, variance is represented by σ². Its formula is: σ² = Σ(x − μ)² / N. On the other hand, the sample variance is represented by s². Its formula is: s² = Σ(x − x̄)² / (n − 1)
For example, if the population standard deviation is 4, the population variance is: σ² = 4² = 16. Similarly, if a sample standard deviation is 5, the sample variance is: s² = 5² = 25
The main point to remember is that σ² describes variability in a population, while s² describes variability in a sample. As with standard deviation, you should first determine whether your observations represent the complete population or a sample before choosing which variance to calculate.
Want a tool that helps you compute sample or population variance and shows you the steps? Use the Variance Calculator.
9. Proportion
A proportion describes the fraction of observations with a particular characteristic. The population proportion is usually represented by p, while the sample proportion is represented by p̂, pronounced as “p-hat.”
Suppose 60% of all registered voters in a town support a particular proposal. The population proportion is: p = 0.60
Now suppose a random sample of 500 voters is surveyed and 58% support the proposal. In this case, the sample proportion is: p̂ = 0.58
The sample proportion does not have to be exactly equal to the population proportion because different samples can produce slightly different results.
In many studies, the true value of p is unknown. As such, researchers calculate p̂ from a sample and use it to estimate the population proportion. Confidence intervals and hypothesis tests can then be used to account for the uncertainty involved in making this estimate.
10. Sampling Error
Sampling error occurs because a sample contains only part of the population. Suppose the true average examination score for all students in a school is 72.4, while a random sample produces an average of 73.1. The difference is the sampling error.
This does not necessarily mean that anything went wrong with the study. The sampling error simply occurs because different random samples contain different observations and will naturally produce slightly different statistics.
If the entire population is measured, there is no sampling error from selecting a subset because no sample has been taken. However, sampling error should not be confused with sampling bias. Sampling bias occurs when the method used to select the sample systematically favors some members of the population over others.
Increasing the sample size can reduce random sampling error, but it does not automatically correct a biased sampling method.
11. Statistical Inference
Statistical inference is another important difference between population and sample data. If you have information from the entire population of interest, you can calculate the population parameters directly.
However, when only a sample is observed, the population parameters are usually unknown. In this case, researchers use inferential statistics to make conclusions about the larger population.
For example, suppose a sample of university students has an average monthly food expenditure of x̄ = $365. The researcher may not simply assume that the population mean is exactly $365. Another sample could give a slightly different result.
Instead, methods such as confidence intervals can estimate a range of plausible values for the population mean. Hypothesis tests can also be used to evaluate claims about population parameters.
The general process is: Population → Sample → Sample statistics → Inference about the population
This relationship is one of the main reasons samples are so important in statistics.
Population vs Sample Examples
The difference between a population and sample becomes easier to understand when you identify the group of interest and the observations actually studied.
The table below gives several examples.
| Study | Population | Sample |
|---|---|---|
| Estimate average weekly study time at a university | All students at the university | 500 selected students |
| Measure customer satisfaction | All customers who purchased during the year | 1,000 surveyed customers |
| Estimate the average weight of cereal boxes | All boxes produced during the shift | 100 inspected boxes |
| Estimate mean Grade 8 mathematics score in a district | All Grade 8 students in the district | 350 selected students |
| Estimate average battery life | All batteries produced by the factory | 200 tested batteries |
| Estimate voter support in a state | All eligible voters in the state | 1,500 surveyed voters |
As shown in the table, the population is the complete group to which the researcher wants the results to apply. The sample contains the observations that are actually selected and measured.
Similarities Between a Population and a Sample
Although a population and sample differ in several ways, they are closely related because the sample is usually drawn from the population and is used to learn about it.
Some of their main similarities include:
- Both contain observations. If the population consists of university students, the sample will also contain students selected from that population. Similarly, if the population consists of manufactured batteries, the sample will contain batteries from that production.
- Both can contain the same variables. Variables such as age, income, examination score, blood pressure, or customer satisfaction can be measured in the entire population or in a sample.
- Both can be summarized using descriptive statistics. Measures such as the mean, median, proportion, variance, and standard deviation can be used to summarize either population or sample data. What changes is the terminology, notation, and, in some cases, the formula used.
- Both require clearly defined observations and variables. The group being studied and the variables being measured should be clearly specified in both cases. If the population is poorly defined, it becomes difficult to determine whether the sample actually represents the intended group.
Therefore, population and sample are not separate ideas. A sample forms part of a population and is often used to provide information about that larger group.
Can the Same Data Be a Population and a Sample?
Yes. Whether a dataset represents a population or sample depends on the research question.
Suppose you have examination scores for all 30 students in one statistics class. If you only want to determine the average score of those 30 students, they represent the population because every member of the group of interest is included. However, suppose you want to use those 30 students to estimate the performance of all first-year students at the university. The same 30 students now form a sample of a much larger population.
Therefore, you cannot determine whether a dataset is a population or sample simply by counting the number of observations. Instead, you should identify the group to which you want the final conclusion to apply.
If every member of that group is included, you have population data. However, if only some members are included, you have sample data.
What Makes a Sample Representative of a Population?
A sample is most useful when it represents the population from which it was selected.
Suppose a university wants to estimate how many hours students study each week. Surveying only students in the library may produce a biased result because those students may study more than the typical student. Collecting more students from the same library would not necessarily solve the problem.
Therefore, sample quality depends on both sample size and how the sample is selected. Random sampling can reduce the chance that certain members of the population are systematically favored. In some studies, stratified sampling may also help ensure that important subgroups are represented.
The target population should be clearly defined before sampling begins. Otherwise, it becomes difficult to decide whether the sample adequately represents the group being studied.
A large sample can improve precision, but a large biased sample can still produce misleading conclusions.
Should You Use a Population or Sample?
Whether you should collect data from the entire population or a sample depends on the size of the population, cost, time, accessibility, and purpose of the study.
If the population is small and every observation can be measured easily, studying the entire population may be reasonable. For example, a manager who wants to summarize the salaries of 18 employees can use data from all employees.
However, studying every member becomes less practical when the population is large. For example, a company with several million customers can usually obtain useful information by collecting data from a carefully selected sample rather than contacting everyone.
Samples are also necessary when testing is expensive, time-consuming, or destructive.
Therefore, use the entire population when doing so is practical and useful. Otherwise, select an appropriate sample and account for the uncertainty involved when generalizing the results to the population.
Frequently Asked Questions
A population contains the entire group you want to study, while a sample contains only part of that population. Researchers commonly collect data from a sample and use the results to learn about the larger population.
Both contain observations that can be measured and analyzed. They can contain the same variables and can both be summarized using measures such as means, proportions, variance, and standard deviation.
A parameter is a numerical value that describes a population, while a statistic describes a sample. For example, μ represents the population mean, whereas x̄ represents the sample mean.
Population size is the total number of members in the population and is usually represented by N. Sample size is the number of observations included in the sample and is represented by n.
Samples usually require less time, money, and effort to study than entire populations. They are particularly useful when the population is large or difficult to measure completely.
A larger sample generally improves precision, but it cannot correct a poor sampling method. A large biased sample may still fail to represent the population properly.
