
How to Use the Variance Confidence Interval Calculator
This calculator allows you to calculate confidence intervals for a single population variance/standard deviation, or the ratio of variances from two independent populations. It allows you to enter either summary statistics or raw data.
1. Summary Data
This option is appropriate when you already have summary statistics such as sample size(s), sample variance(s), or sample standard deviation(s). To construct a variance confidence interval from summary data using the calculator:
- Select One Sample or Two Samples, depending on the confidence interval you want to calculate.
- Enter the confidence level, such as 95 for a 95% confidence interval.
- Select Summary Data under Data Input Type.
- Enter the sample size (n) for one sample, or the sample sizes (n₁ and n₂) for two samples.
- Select Sample Variance or Sample Standard Deviation and enter the corresponding value for each sample.
- Click Calculate.
The calculator will return the lower and upper confidence limits for the population variance or variance ratio. It also provides the corresponding confidence interval for the population standard deviation or standard deviation ratio, with a step-by-step solution.
2. Raw Data
The raw data option allows you to construct similar confidence intervals from individual observations. To construct the confidence interval from raw data using the calculator:
- Select One Sample or Two Samples, depending on the confidence interval you want to calculate.
- Enter the confidence level
- Select the Raw Data option.
- Enter or paste the observations into the input field(s), separating the values using commas, spaces, tabs, or line breaks.
- Click Calculate
The calculator will automatically calculate the sample size(s) and sample variance(s) and then apply them to construct the required confidence interval. It will also provide a clear, step-by-step solution, explaining how the confidence interval was constructed.
What Is a Variance Confidence Interval?
A variance confidence interval is a range of values used to estimate the variance of a population based on sample data. Since the population variance is usually unknown, we use the sample variance to estimate it. However, the sample variance may differ from the actual population variance because of random sampling variation.
Constructing the variance confidence interval helps us account for this uncertainty by providing a range of plausible values for the population variance.
For example, suppose a manufacturer wants to estimate the variance in the weights of its products. A random sample of 20 packages gives a sample variance of 25 g². Using the chi-square distribution, the 95% confidence interval for the population variance is [14.4586, 53.3317] g².
This means we are 95% confident that the population variance lies between 14.4586 g² and 53.3317 g², assuming the conditions for the confidence interval are satisfied.
The corresponding confidence interval for the population standard deviation is [3.8025, 7.3029] g.
One-Sample vs. Two-Sample Variance Confidence Intervals
There are two common types of variance confidence intervals:
- One-sample variance confidence interval: Used to estimate the variance or standard deviation of a single population. It is calculated using the chi-square distribution.
- Two-sample variance confidence interval: Used to estimate the ratio of variances or standard deviations from two independent populations. It is calculated using the F distribution.
For example, if you want to estimate the variability in the weights of products manufactured by one machine, you would use a one-sample variance confidence interval. However, if you want to compare the variability in the weights of products manufactured by two independent machines, you would use a two-sample variance confidence interval.
Variance Confidence Interval Formulas
The formula used to calculate a variance confidence interval depends on whether we have one sample or two independent samples.
1. Confidence Interval Formula for a Single Population Variance
For a single population variance, the confidence interval formula is:
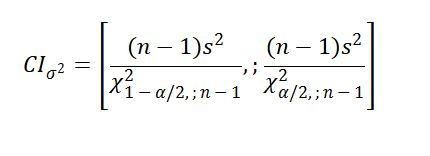
Where:
- n is the sample size.
- s² is the sample variance.
- α is the significance level, calculated as 1 − confidence level.
- n − 1 is the degrees of freedom.
- χ² is the chi-square critical value. Its subscripts indicate the cumulative left-tail probability and degrees of freedom.
Tip. The lower confidence limit is calculated using the upper chi-square critical value, while the upper confidence limit uses the lower chi-square critical value.
After computing the confidence interval for population variance, you can obtain the confidence interval for the population standard deviation by taking the square roots of the lower and upper variance confidence limits.
Therefore, if the confidence interval for the population variance is [L, U], the corresponding confidence interval for the population standard deviation is: CI for σ = [√L, √U]
If you are given the sample standard deviation rather than the sample variance, simply square it before using the variance confidence interval formula.
2. Confidence Interval Formula for the Ratio of Two Population Variances
For two independent samples from normally distributed populations, the confidence interval for the ratio of population variances is calculated using the F distribution.
The formula is:
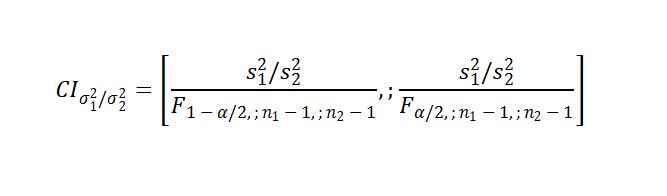
Where:
- n₁ and n₂ are the sample sizes.
- s₁² and s₂² are the sample variances.
- α is the significance level.
- n₁ − 1 is the numerator degrees of freedom.
- n₂ − 1 is the denominator degrees of freedom.
- F is the F critical value at the indicated cumulative left-tail probability and degrees of freedom.
In this formula, the sample variance ratio is s₁²/s₂². Therefore, Sample 1 is the numerator, while Sample 2 is the denominator.
To obtain the confidence interval for the ratio of population standard deviations (σ₁/σ₂), we take the square roots of the two variance-ratio confidence limits.
How to Construct a Confidence Interval for a Single Population Variance
Example. A packaging company wants to estimate the population variance in the weights of its products. A random sample of 20 packages has a sample standard deviation of 5 g. Assuming the package weights are normally distributed, construct a 95% confidence interval for the population variance and standard deviation.
Solution
Since we want to estimate the variance of a single population, we use the chi-square distribution and follow these steps:
Step 1: State the Confidence Interval Formula
The confidence interval formula for a single population variance is:
Step 2: Identify the Parameters and Find the Critical Values
From the question, we know that:
- Sample size, n = 20
- Sample standard deviation, s = 5 g
- Sample variance, s² = 5² = 25 g²
- Confidence level = 95%
- Significance level, α = 1 − 0.95 = 0.05
- Degrees of freedom, df = 20 − 1 = 19
To find the chi-square critical values, we divide the significance level by two. Using the Chi-Square Table, locate the row for 19 degrees of freedom. Since the table uses right-tail probabilities, we obtain:
- Upper chi-square critical value: χ21-0.05/2, 19 = 32.8523.
- Lower chi-square critical value: χ20.05/2, 19 = 8.9065.
You can also find these values using the Chi-Square Critical Value Calculator.
Step 3: Substitute the Values into the Formula
Substituting the values into the confidence interval formula gives:
= [475/32.8523, 475/8.9065]
= [14.4586, 53.3317]
Therefore, the 95% confidence interval for the population variance is [14.4586, 53.3317] g².
To find the confidence interval for the population standard deviation, take the square roots of the variance limits:
= [√14.4586, √53.3317]
= [3.8025, 7.3029]
Therefore, the 95% confidence interval for the population standard deviation is [3.8025, 7.3029] g.
Step 4: Interpret the Confidence Interval
We are 95% confident that the population variance in package weights lies between 14.4586 g² and 53.3317 g². The corresponding confidence interval for the population standard deviation is [3.8025, 7.3029] g.
How to Construct a Confidence Interval for the Ratio of Two Population Variances
Example. A school wants to compare the variability in examination scores between students taught using two different teaching methods. A random sample of 16 students taught using Method A has a sample variance of 36, while a random sample of 21 students taught using Method B has a sample variance of 9. Assuming the examination scores are normally distributed in both populations, construct a 95% confidence interval for the ratio of the two population variances.
Solution
Since we want to estimate the ratio of variances from two independent populations, we use the F distribution and follow these steps:
Step 1: State the Confidence Interval Formula
The confidence interval formula for the ratio of two population variances is:
Step 2: Identify the Parameters and Find the Critical Values
From the question, we know that:
- Sample 1 size, n₁ = 16
- Sample 1 variance, s₁² = 36
- Sample 2 size, n₂ = 21
- Sample 2 variance, s₂² = 9
- Confidence level = 95%
- Significance level, α = 1 − 0.95 = 0.05
- Numerator degrees of freedom, df₁ = 16 − 1 = 15
- Denominator degrees of freedom, df₂ = 21 − 1 = 20
To find the F critical values, we use the F table or an F critical value calculator. Using a right-tail probability of 0.025, we obtain:
- Upper F critical value: F1-0.05/2, 15, 20 = 2.573096.
- Lower F critical value: F0.05/2, 15, 20) = 1/F(0.975, 20, 15) = 1/2.755902 = 0.362858.
Here, the probabilities in F(·) are cumulative left-tail probabilities. To find the lower F critical value using a right-tail F table, we reverse the numerator and denominator degrees of freedom and take the reciprocal of the corresponding upper critical value.
You can also find these values using the F Critical Value Calculator.
Step 3: Substitute the Values
Substituting the values into the confidence interval formula gives:
= [4/2.573096, 4/0.362858]
= [1.5545, 11.0236]
Therefore, the 95% confidence interval for the ratio of population variances is [1.5545, 11.0236].
To find the confidence interval for the ratio of population standard deviations, take the square roots of the variance ratio limits:
= [√1.5545, √11.0236]
= [1.2468, 3.3202]
Therefore, the 95% confidence interval for the ratio of population standard deviations is [1.2468, 3.3202].
Step 4: Interpret
We are 95% confident that the ratio of the population variance in examination scores for students taught using Method A to that of students taught using Method B lies between 1.5545 and 11.0236.
Since the confidence interval does not include 1, we conclude that the population variances differ significantly at the 5% significance level. Specifically, the variance in examination scores for students taught using Method A is significantly greater than that of students taught using Method B.
Assumptions of the Variance Confidence Interval
Before calculating a variance confidence interval using the chi-square or F distribution, you should consider the following assumptions:
- Random sampling: The data should come from a sampling process that supports inference about the population.
- Independence: The observations should be independent of each other.
- Numerical data: The variable should be quantitative, such as weight, height, or time.
- Normality: The observations should come from normally distributed populations.
- Independent samples: For the two-sample procedure, the two samples must be independent of each other.
The normality assumption is particularly important because the chi-square and F distributions used in these formulas depend on it. When the data are highly skewed or contain extreme outliers, the confidence interval may be unreliable.
If you have raw observations, you can assess normality using the Shapiro–Wilk Test Calculator or the Kolmogorov-Smirnov Test Calculator. You should also examine the distribution for skewness and outliers.
Variance Confidence Interval vs. Variance Hypothesis Test
Although both procedures are concerned with population variances, they answer different questions. A variance confidence interval estimates a range of plausible values for the population variance. In contrast, a variance hypothesis test determines whether there is sufficient statistical evidence to reject a particular claim about the population variance.
For example, suppose a manufacturer claims that the population variance in package weights is 16 g². If your objective is to estimate the population variance, use this confidence interval calculator.
However, if you want to determine whether the population variance differs significantly from 16 g², use the One-Sample Variance Test Calculator. Similarly, if you want to test whether two independent populations have equal variances, use the F-Test Calculator.
Frequently Asked Questions
A variance confidence interval calculator is a tool used to estimate the variance or standard deviation of a population using sample data. This calculator also supports confidence intervals for the ratio of two independent population variances and provides step-by-step calculations.
Yes. To obtain a confidence interval for the population standard deviation, take the square roots of the lower and upper variance confidence limits. This calculator provides both intervals automatically.
The chi-square distribution is used for a confidence interval for a single population variance. However, when constructing a confidence interval for the ratio of two independent population variances, we use the F distribution.
When the confidence interval for the ratio of two population variances includes 1, the observed data are consistent with equal population variances. Therefore, there is insufficient evidence to conclude that the two population variances differ at the corresponding significance level.
The classical chi-square and F confidence interval methods assume normally distributed populations. If the data depart substantially from normality, the intervals may not be reliable. In such cases, a more suitable method, such as an appropriately designed bootstrap confidence interval, may be needed.
