
Type I vs Type II Errors: Differences, Examples & Statistical Power
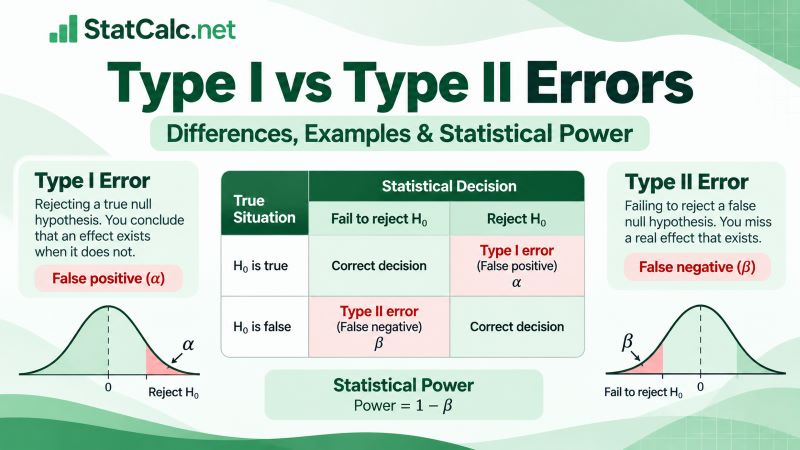
Type I and Type II errors are the two mistakes we can make when using a hypothesis test to make a decision about a population. A Type I error occurs when we reject the null hypothesis even though it is actually true. In simple terms, we conclude that an effect or difference exists when it does not. This is also known as a false positive. On the other hand, a Type II error occurs when we fail to reject the null hypothesis even though it is actually false. In this case, a real effect or difference exists, but the hypothesis test fails to detect it. This is also called a false negative.
Although the two errors may sound similar at first, the difference becomes much easier to understand once you consider the true state of the null hypothesis and the decision made from the sample data.
In this guide, we explain Type I vs Type II errors, their relationship with alpha, beta, and statistical power, and how to identify them using practical examples.
Type I vs Type II Errors at a Glance
The main difference between Type I and Type II errors is the type of incorrect conclusion you make. A Type I error finds an effect that is not really there, while a Type II error misses an effect that actually exists.
The table below summarizes the key differences.
| Type I Error | Type II Error | |
|---|---|---|
| Definition | Rejecting H₀ when H₀ is true | Failing to reject H₀ when H₀ is false |
| Also called | False positive | False negative |
| What happens? | You detect an effect that does not exist | You fail to detect an effect that exists |
| Probability | α | β |
| Related concept | Significance level | Statistical power |
| How to reduce it | Use a smaller α and control multiple testing | Increase power, often through a larger sample or better study design |
A simple way to remember the difference is:
- Type I error = false alarm. You conclude that something happened when it did not.
- Type II error = missed detection. Something really happened, but your test failed to detect it.
However, these definitions make more sense when we place them within the hypothesis-testing process.
How Type I and Type II Errors Occur in Hypothesis Testing
Every hypothesis test starts with a null hypothesis, H₀, and an alternative hypothesis, H₁. After analyzing the sample data, we either reject H₀ or fail to reject H₀.
At the population level, however, H₀ is either true or false. Combining these two possible realities with the two possible statistical decisions gives four outcomes.
| Reality | Fail to Reject H₀ | Reject H₀ |
|---|---|---|
| H₀ is true | Correct decision | Type I error |
| H₀ is false | Type II error | Correct decision |
Therefore, an error only occurs when the decision made from the sample does not match what is actually true in the population.
If H₀ is true and we fail to reject it, we have made the correct decision. Similarly, if H₀ is false and we reject it, the hypothesis test has correctly detected a real effect. The two remaining possibilities are Type I and Type II errors.
What Is a Type I Error?
A Type I error occurs when we reject a true null hypothesis. For instance, suppose a researcher is testing whether a new teaching method improves examination scores. The hypotheses are:
- H₀: The new teaching method does not improve the population mean score.
- H₁: The new teaching method improves the population mean score.
Now suppose the teaching method actually has no effect. This means H₀ is true. However, because samples contain random variation, the researcher may obtain a result that appears statistically significant and reject H₀.
The researcher would then conclude that the teaching method improves examination scores even though it does not. That is a Type I error.
In simple terms, Type I error = concluding that an effect exists when it actually does not. This is why a Type I error is commonly described as a false positive.
Type I Error and the Significance Level
The probability of a Type I error is represented by the Greek letter α (alpha). When a researcher selects α = 0.05, the testing procedure is designed so that, when the null hypothesis is true and the assumptions of the test are satisfied, it will incorrectly reject H₀ about 5% of the time over repeated studies.
Therefore, P(Type I error | H₀ is true) = α
If α = 0.05, P(Type I error | H₀ is true) = 0.05. This does not mean that every statistically significant result has a 5% probability of being wrong. Alpha describes the long-run error rate of the testing procedure when the null hypothesis is true.
When using the p-value approach, you normally reject H₀ when p < α. If you already have a test statistic and want to find its corresponding probability, you can use our P Value Calculator.
What Is a Type II Error?
A Type II error occurs when we fail to reject a false null hypothesis. Consider the same teaching-method example. Suppose the new teaching method really does improve examination scores. In this case, H₀ is false.
However, imagine that the study uses a small sample and the difference observed in that particular sample is not large enough to reach statistical significance. The researcher fails to reject H₀ and concludes that there is not enough evidence that the teaching method improves examination scores.
Because a real improvement actually exists, this conclusion represents a Type II error.
In simple terms, Type II error = failing to detect an effect that actually exists. This is why a Type II error is commonly called a false negative.
It is important to say “fail to reject H₀” rather than “accept H₀.” A nonsignificant result does not prove that the null hypothesis is true. It simply means that the available data did not provide enough evidence to reject it.
Type II Error and Beta
The probability of making a Type II error is represented by β (beta). Therefore, P(Type II error | H₀ is false) = β
Unlike alpha, beta is not usually one fixed value for every possible false null hypothesis. The probability of missing a real effect depends on factors such as the true effect size, sample size, variability in the data, significance level, and statistical test being used.
For example, suppose a study has β = 0.20 for detecting a particular effect size. This means that if an effect of that size really exists, the study has a 20% probability of failing to detect it. The remaining probability represents the statistical power of the test.
Type II Error and Statistical Power
Statistical power is the probability that a hypothesis test correctly rejects H₀ when H₀ is false. Power and Type II error are directly related. In particular, Power = 1 − β.
For example, if β = 0.20 then Power = 1 − 0.20 = 0.80. Therefore, the test has 80% power to detect the specified effect.
In practical terms, an 80% power means that if the specified effect really exists and the study were repeated many times under the same conditions, the testing procedure would detect it about 80% of the time. The remaining 20% represents the Type II error rate.
This is why sample size planning is important before collecting data. A study with very low power may fail to detect an effect even when that effect is real.
Type I vs Type II Error Example
Let us use one example to compare the two errors directly.
Suppose a researcher wants to determine whether a new medication lowers mean blood pressure compared with the current treatment. The hypotheses are:
- H₀: The new medication does not lower mean blood pressure more than the current treatment.
- H₁: The new medication lowers mean blood pressure more than the current treatment.
A Type I error occurs if the researcher concludes that the new medication works better when, in reality, it does not. However, a Type II error would occur if the researcher concluded that there is not enough evidence that the new medication works better when, in reality, it does.
Therefore, the distinction is based on what is actually true:
- If no real improvement exists but we claim one does, we make a Type I error.
- If a real improvement exists but we fail to detect it, we make a Type II error.
Relationship Between P-Values and Type I Errors
The p-value and Type I error are related, but they do not mean the same thing.
In hypothesis testing, we compare the p-value with the chosen significance level, α, to decide whether to reject the null hypothesis. The decisions are:
- Reject H₀ if p < α
- Fail to reject H₀ if p ≥ α
A Type I error can occur when we reject H₀ even though it is actually true. The significance level controls how often this error is allowed to occur in the long run. For example, if α = 0.05, the test has a 5% Type I error rate when the null hypothesis is true.
However, the p-value is not the probability of making a Type I error. For example, if p = 0.03, this does not mean there is a 3% chance that your conclusion is wrong. Instead, it means that if the null hypothesis were true, there would be a 3% probability of obtaining the observed result, or a more extreme result.
Therefore, the p-value helps us decide whether the evidence against H₀ is strong enough, while α sets the cutoff we use to make that decision.
The Trade-Off Between Type I and Type II Errors
Type I and Type II errors are connected. If everything else remains unchanged, making it harder to reject H₀ reduces the probability of a Type I error. However, it usually makes a Type II error more likely.
For example, suppose you reduce the significance level from α = 0.05 to α = 0.01. You now require stronger evidence before rejecting H₀. This reduces the Type I error rate because false positives become less likely. However, the stricter cutoff also makes it harder to detect a real effect, which can increase β and reduce statistical power.
The reverse is also true. Increasing α makes it easier to detect a real effect, but it also increases the risk of rejecting H₀ when it is actually true.
This does not mean you must simply accept one error in exchange for the other. Increasing the sample size or improving the precision of the study can increase power while keeping alpha unchanged.
How to Reduce the Risk of a Type I Error
The most direct way to reduce the Type I error rate is to choose a smaller significance level before conducting the hypothesis test. For example, using α = 0.01 instead of α = 0.05 makes it more difficult to reject H₀.
However, using a smaller alpha can also reduce statistical power when other factors remain unchanged.
You should also be careful when conducting many hypothesis tests on the same data. If you repeatedly test different hypotheses at α = 0.05, the probability of obtaining at least one false-positive result can become much larger than 5%.
Appropriate multiple-comparison procedures can help control this problem. For example, ANOVA is commonly used when comparing three or more group means rather than performing many separate t-tests.
Most importantly, choose the hypotheses, significance level, and analysis plan before examining the final results whenever possible. Changing the analysis repeatedly until a statistically significant result appears can greatly increase the risk of false-positive findings.
How to Reduce the Risk of a Type II Error
A Type II error becomes less likely when the statistical test has greater power.
One of the most effective ways to increase power is to use a sufficiently large sample. Larger samples generally produce more precise estimates and make real effects easier to detect.
Power can also improve when measurements are more reliable and unnecessary variability is reduced. A well-designed study may therefore detect an effect more easily than a poorly controlled study with the same number of observations.
Larger true effects are also easier to detect than very small effects. However, the researcher does not normally control the true effect size.
Increasing α can also increase power, but this comes at the cost of a higher Type I error rate. For this reason, changing alpha should be based on the consequences of the two errors rather than simply trying to obtain statistical significance.
What Factors Affect Type I and Type II Errors?
Several parts of the study design influence the likelihood of statistical errors. The table below summarizes some of the most important relationships.
| Change | Type I Error | Type II Error / Power |
|---|---|---|
| Decrease α | Decreases | β tends to increase and power decreases |
| Increase α | Increases | β tends to decrease and power increases |
| Increase sample size | Remains at the chosen α under the test assumptions | β decreases and power increases |
| Larger true effect | No direct change to chosen α | Easier to detect, so power increases |
| Lower measurement variability | No direct change to chosen α | Power generally increases |
| Perform many unadjusted tests | Overall false-positive risk increases | Depends on the testing strategy |
These relationships assume that the statistical test is correctly specified and its assumptions are reasonably satisfied.
Which Is Worse: Type I or Type II Error?
Neither Type I nor Type II error is always worse. The more serious error depends on the consequences of making the wrong decision.
Suppose a clinical trial tests a new treatment that has serious side effects. A Type I error could lead researchers to conclude that the treatment works when it actually does not, potentially exposing patients to unnecessary risks. In this situation, avoiding a false positive may be especially important.
In another study, researchers may be testing a screening method for a dangerous condition. Failing to detect a real problem could have serious consequences, making a Type II error more concerning.
Therefore, the appropriate balance between alpha and beta should depend on the research question and the consequences of each error.
Statistics can quantify the risks, but deciding which error is more serious requires subject-matter judgment.
Can You Completely Eliminate Type I and Type II Errors?
No hypothesis test can completely eliminate both errors when decisions are made from sample data.
Sample statistics vary from one random sample to another. As a result, there will normally be some overlap between results that could occur when H₀ is true and results that could occur when H₀ is false.
The goal is therefore not to reduce both error probabilities to zero. Instead, researchers design studies so that the risks are acceptably low for the problem being studied.
Choosing an appropriate significance level helps control Type I error, while adequate statistical power helps reduce Type II error. Good sampling, reliable measurements, suitable statistical tests, and an adequate sample size also improve the quality of the final decision.
Common Mistakes When Interpreting Type I and Type II Errors
Several mistakes can make these concepts more confusing than they need to be.
- Do not say that a Type I error means rejecting any null hypothesis. It is only an error when H₀ is actually true.
- Do not say that a Type II error means failing to reject any null hypothesis. It is only a Type II error when H₀ is actually false.
- Do not interpret a nonsignificant result as proof that H₀ is true. The correct wording is normally that you fail to reject H₀.
- Do not interpret the p-value as the probability that H₀ is true. The p-value is calculated under the assumption that H₀ is true.
- Do not interpret p = .05 as a 5% probability that you made a Type I error. Alpha controls the long-run Type I error rate of the testing procedure when H₀ is true.
- Do not assume that a larger sample lowers the chosen alpha level. A larger sample mainly helps improve power and reduce the probability of a Type II error for a specified alternative.
Frequently Asked Questions
The main difference between Type I and Type II errors is that a Type I error occurs when you reject H₀ even though it is true, while a Type II error occurs when you fail to reject H₀ even though it is false. In other words, Type I errors are false positives, while Type II errors are false negatives.
The probability of a Type I error, conditional on the null hypothesis being true, is the significance level α. For example, a test conducted at α = 0.05 has a 5% long-run Type I error rate when H₀ is true, and the assumptions of the test are satisfied.
The probability of a Type II error is β. Its value depends on the true effect being considered, the sample size, variability, significance level, and statistical procedure.
Statistical power is the probability of correctly rejecting a false null hypothesis. It is calculated as Power = 1 − β. Therefore, increasing power reduces the probability of a Type II error.
No. The more serious error depends on the situation. A false positive may be more costly in one study, while failing to detect a real effect may have greater consequences in another.
