
Measures of Central Tendency: Mean, Median & Mode
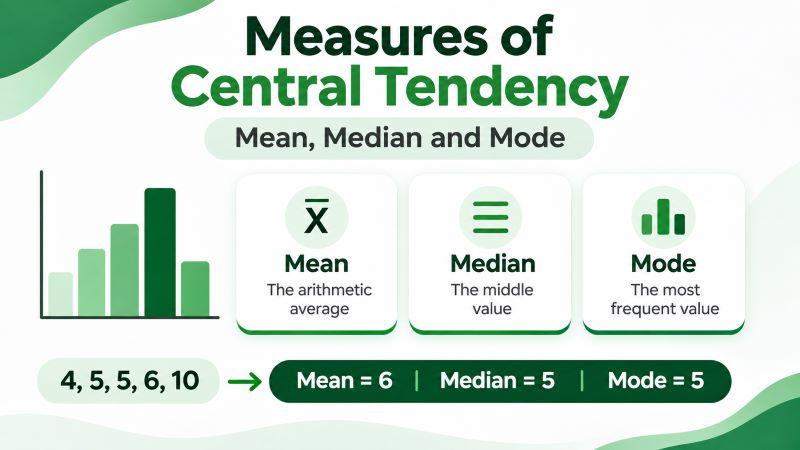
Measures of central tendency are statistics used to describe the center or typical value of a dataset. The three most common measures are the mean, median, and mode.
For example, suppose five students obtain the following examination scores: 60, 65, 70, 70, 75. The mean score is 68, while the median and mode are both 70. Although all three describe the same dataset, they represent its center in different ways.
The mean gives the arithmetic average, the median identifies the middle value, and the mode shows the value that occurs most often. Therefore, the most appropriate measure depends on the type of data, the shape of the distribution, and whether unusually high or low values are present.
In this guide, we explain the main measures of central tendency, compare the mean, median, and mode, and show when each measure is most appropriate.
What Are Measures of Central Tendency?
A measure of central tendency is a single value used to represent the center of a dataset. When a dataset contains many observations, listing every value may not provide a clear picture of what is typical. A measure of central tendency summarizes the data using one value that represents its central location.
The three main measures are:
- Mean. The arithmetic average of the observations.
- Median. The middle value after the observations are arranged in order.
- Mode. The value or category that occurs most frequently.
For example, consider the dataset: 4, 5, 5, 6, 10. The mean is 6, the median is 5, and the mode is also 5. The three values do not have to be equal because they determine the center differently.
Want to calculate these measures for your own dataset? Use our Mean Median Mode Calculator.
Types of Measures of Central Tendency
The table below compares the three main measures of central tendency and shows the type of information each one provides.
| Measure | What It Represents | Suitable Data | Main Strength |
|---|---|---|---|
| Mean | Arithmetic average | Quantitative data | Uses every numerical value |
| Median | Middle value | Ordinal or quantitative data | Less affected by outliers |
| Mode | Most frequent value or category | Categorical or quantitative data | Can be used with nominal data |
The mean is usually preferred when numerical data are reasonably symmetric and do not contain influential outliers. The median becomes more useful when the distribution is skewed or contains extreme values because these observations have less effect on its position. However, the mode is different because it is based on frequency, which makes it useful for identifying the most common value and also allows it to be used with categorical data.
Let us look at each measure in more detail.
1. Mean
The mean, also called the arithmetic mean or the average, is the sum of all observations divided by the number of observations.
For sample data, it is represented by x̄, and its formula is:
x̄ = Σx / n
where:
- Σx is the sum of the observations.
- n is the number of observations.
For example, consider the dataset: 5, 7, 8, 10, 15. To find the mean, we simply sum all the observations to get Σx and divide the result by the total number of observations (n).
Therefore, mean, x̄ = (5 + 7 + 8 + 10 + 15)/5
= 45/5
= 9
Therefore, the mean for the dataset is 9.
One important characteristic of the mean is that every observation contributes to its value. This is useful because the mean considers all of the numerical information in the dataset. However, it also means that unusually large or small values can pull the mean away from the center of most observations.
When the data are fairly symmetric and do not contain strong outliers, the mean is often the most useful measure of central tendency.
Want a tool that quickly computes the mean and shows you the steps? Use the Mean Calculator.
2. Median
The median is the middle value after the observations have been arranged from smallest to largest. For example, for the dataset: 3, 5, 8, 10, 14, the median is 8 because it lies in the middle of the ordered data.
However, when there is an even number of observations, there is no single middle value. In this case, the median is the average of the two central values. For instance, consider the dataset: 3, 5, 8, 10, 14, 16. The two middle values are 8 and 10. Therefore, Median = (8 + 10) / 2 = 9
Unlike the mean, the median does not depend heavily on the exact size of observations far away from the center. This makes it particularly useful for skewed data and datasets containing extreme values.
Income and house prices are common examples where the median may give a better indication of a typical observation than the mean.
If you only need to find the middle value of your data and see the steps, use our Median Calculator.
3. Mode
The mode is the value or category that occurs most frequently in a dataset. Consider the dataset: 2, 3, 3, 3, 5, 7. In this case, the mode is 3 because it occurs more often than any other value.
Unlike the mean and median, the mode can also be used with categorical data. For example, suppose customers select their preferred payment method: Card, Cash, Card, Mobile, Card, Cash. The mode is Card because it is the most common response.
A dataset can have one mode, more than one mode, or no meaningful mode. If the dataset has one mode, it is said to be unimodal; if it has two modes, it is called bimodal; and if it has more than two modes, it is said to be multimodal.
If every value occurs with the same frequency, there is no value that occurs more often than the others. In this case, we say that the data has no mode.
Therefore, the mode is most useful when the frequency of a value or category is important.
Need an online tool that computes the mode for any dataset, shows the steps, and tells you whether the dataset has no mode, unimodal, bimodal, or multimodal? Use the mode calculator.
Mean vs Median vs Mode
Although the mean, median, and mode all describe central tendency, they do not provide the same type of information. The table below summarizes their main differences.
| Feature | Mean | Median | Mode |
|---|---|---|---|
| Represents | Arithmetic average | Middle position | Highest frequency |
| Uses every numerical value | Yes | No | No |
| Affected by outliers | Yes | Much less | Usually not |
| Suitable for nominal data | No | No | Yes |
| Suitable for ordinal data | Usually not preferred | Yes | Yes |
| Suitable for quantitative data | Yes | Yes | Yes |
| May have multiple values | No | No | Yes |
The most important difference is how each measure identifies the center. The mean depends on the numerical size of every observation, the median depends on the position of observations after they are ordered, while the mode depends on frequency.
For this reason, the same dataset can produce different values for all three measures without any of them being incorrect.
Which Measure of Central Tendency Should You Use?
Wondering which measure of central tendency to use? The appropriate measure depends on the level of measurement (type of data) and the shape of the distribution.
The table below summarizes the appropriate measures for each level of measurement.
| Level of Measurement | Appropriate Measure |
|---|---|
| Nominal | Mode |
| Ordinal | Median or mode |
| Interval | Mean, median, or mode |
| Ratio | Mean, median, or mode |
From the table, we learn that:
- The mode is the appropriate measure when working with nominal data such as blood group, country, or product type because the categories do not have a meaningful order or average.
- Median or mode is appropriate for ordinal data. However, median is most suitable for ordinal data because it respects the inherent order and ranking of the categories without assuming equal intervals between them. Mode, on the other hand, only identifies the most frequent category and ignores the overall position or shape of the distribution.
- The mean is the most suitable measure when working with interval or ratio data, with a reasonably symmetric distribution. However, if the data is strongly skewed or contains extreme values, you should use the median instead. You may also use the mode for interval/ratio data, but it is generally less informative unless the distribution is explicitly bimodal or deals with discrete whole numbers.
Therefore, the level of measurement tells you which measures are possible, while the shape of the data helps you decide which one is most informative.
Effect of Outliers on Measures of Central Tendency
The mean is more sensitive to outliers than the median or mode. To help you understand how these measures are affected by outliers, consider the following salaries: $3,000, $3,200, $3,400, $3,600, $3,800. As you can see, the values are fairly close together. In this case, both the mean and median provide a reasonable description of the center.
Now suppose a sixth employee earns $30,000. This large salary value pulls the mean upward because it contributes directly to the total used to calculate the average. In this case, the median would provide more insightful information than the mean because it depends on the middle position rather than the size of the highest observation.
This is why the median is often used to report variables such as income, property prices, and other data where a few unusually large values may be present.
However, this does not mean that the mean becomes mathematically incorrect. It simply means that it may not represent what most observations look like. As such, it is advisable to check the data for outliers or extreme values before choosing to use the mean to summarize a dataset.
Measures of Central Tendency and Skewness
The shape of a distribution also affects the relationship between the mean and median. For an approximately symmetric distribution, the mean and median are usually close. However, if the distribution is skewed (either to the right or left), it pulls the mean in that direction.
For instance, in a right-skewed distribution, a small number of high observations create a longer tail on the right, consequently pulling the mean upward. In this case, the mean will be greater than the median (Mean > Median). On the other hand, in a left-skewed distribution, low observations extend the left tail and pull the mean downward. As a result, the mean becomes less than the median (Mean < Median). However, if you’re working with a perfectly normal distribution, the mean, median, and mode will be equal (Mean = Median = Mode).
Note. The mode does not always follow a fixed position relative to the mean and median in real datasets. This mainly occurs because there may be more than one mode or no clear mode.
Want to learn more about skewness and calculate it for your dataset? Use the Skewness Calculator.
When Is the Mean the Best Measure?
The mean is usually the most useful measure when the data are quantitative, reasonably symmetric, and free from influential outliers.
Examples might include:
- Heights of adults in a reasonably homogeneous group.
- Examination scores that are approximately symmetric.
- Repeated measurements taken under stable conditions.
One advantage of the mean is that every observation contributes to the calculation. As a result, it makes use of more numerical information than either the median or mode.
The mean also plays an important role in many other statistical procedures. For example, variance, standard deviation, standard error, t-tests, ANOVA, and regression all involve means in some form. However, this advantage can become a limitation when a few very large or small values dominate the calculation.
Therefore, the mean should not automatically be used simply because the data are numerical. You should always consider the distribution of the data.
When Is the Median the Best Measure?
The median is often preferred when numerical data are skewed or contain strong outliers.
Suppose most homes in an area sell for between $200,000 and $300,000, but a few luxury properties sell for several million dollars. In this case, the high-value properties may pull the mean house price upward, making it much higher than the price of a typical home. Using the median over the mean helps you avoid much of this problem because it identifies the middle observation after the prices are ordered.
The median is also useful for ordinal data, where categories can be ranked but the distance between categories is not necessarily equal. For example, consider a categorical variable with these ordered categories: Poor → Fair → Good → Very Good → Excellent. Since the categories have a clear order, identifying the middle response can be meaningful even though calculating an arithmetic mean may not be.
Therefore, you should use the median when the middle position gives a more useful description than the arithmetic average.
When Is the Mode the Best Measure?
The mode is most useful when you want to identify the most common value or category. For example, a clothing retailer may be more interested in the most commonly purchased shirt size than the arithmetic average of shirt sizes. Similarly, a survey may ask customers to select their preferred payment method. Since the responses are categories, the mean and median would not provide a meaningful summary.
The mode can therefore be used with nominal, ordinal, and quantitative data. It can also provide information that the mean and median do not show. For example, a dataset with two common peaks may be bimodal, which could suggest that two different groups are present in the data.
However, the mode is not always useful. A dataset may have no clear mode, or several values may occur with the same highest frequency. For this reason, the mode is appropriate when frequency itself is meaningful.
Advantages and Limitations of Mean, Median, and Mode
The mean, median, and mode are all useful measures of central tendency. However, each has situations where it works better than the others. Their main advantages and limitations are outlined below.
1. Mean
Some of the advantages of using the mean include:
- It uses every observation in the dataset.
- It is widely used in statistical analysis and is required in many methods, including standard deviation, t-tests, ANOVA, and regression.
- It works well when numerical data are reasonably symmetric and do not contain strong outliers.
However, the mean is associated with the following limitations:
- It can be strongly affected by unusually high or low values (outliers).
- It may give a poor picture of the center when the distribution is highly skewed.
- It does not make sense for categorical data
2. Median
The median is associated with various advantages and disadvantages. Some of its advantages include:
- It is less affected by outliers because it depends on the middle position rather than the size of every observation.
- It works well for skewed numerical data such as income or house prices.
- It works well with ordinal data.
Some of its limitations are:
- It does not take the exact value of every observation into account.
- Two datasets with very different values away from the center can have the same median.
3. Mode
The mode is associated with the following advantages:
- It can be used with categorical as well as numerical data.
- It directly shows the value or category that occurs most often.
- It is useful when the most common response is more important than the average.
However, some of its limitations include:
- A dataset may have more than one mode or no clear mode at all.
- The mode may not lie near the center of the data.
- It does not use most of the numerical information in the dataset.
Therefore, the best measure of central tendency depends on the data you have and what you want the summary to show.
Can You Report More Than One Measure of Central Tendency?
Yes. In some cases, reporting more than one measure provides useful information about the data. For example, suppose a study reports: Mean income = $82,000 and Median income = $55,000. The large difference between these two values suggests that high incomes may be pulling the mean upward. Similarly, reporting the mode may be useful if one particular response or value occurs much more frequently than the others.
However, there is usually no need to report all three simply because they can be calculated. For approximately symmetric numerical data, the mean is often reported together with the standard deviation. On the other hand, the median is commonly reported together with the interquartile range when numerical data is strongly skewed.
Therefore, you should report a measure that helps the reader understand the data rather than simply increase the number of statistics presented.
Measures of Central Tendency vs Measures of Dispersion
Measures of central tendency describe where the center of a dataset lies. They do not show how widely the observations are spread.
Consider these two datasets:
Dataset A: 48, 49, 50, 51, 52
Dataset B: 10, 30, 50, 70, 90
Both have a mean of 50, but their observations are distributed very differently. This is why measures of central tendency are often reported together with measures of dispersion.
Common measures of dispersion include:
For example, the mean is commonly reported with the standard deviation, while the median is often reported with the interquartile range when the data are skewed.
You can use our Descriptive Statistics Calculator when you want to calculate the center, spread, position, and shape of a dataset together.
Are Mean, Median, and Mode the Only Measures of Central Tendency?
Mean, median, and mode are the most commonly used measures, but they are not the only ways to describe a typical or central value.
Other measures may be useful in particular situations. These include:
- Weighted Mean
- Geometric Mean
- Harmonic Mean
- Trimmed Mean
The appropriate measure therefore depends on the type of data and the purpose of the analysis. However, for most introductory statistics courses such as AP statistics, the mean, median, and mode remain the main measures of central tendency.
Frequently Asked Questions
Measures of central tendency are statistics used to describe the center or typical value of a dataset. The three most common are the mean, median, and mode.
The three main measures are the mean, median, and mode. The mean is the arithmetic average, the median is the middle value, and the mode is the most frequently occurring value.
The mean is the most affected by outliers because every numerical observation contributes to its calculation. The median is much less sensitive to extreme values.
The median is generally preferred for strongly skewed numerical data because extreme observations in the long tail can pull the mean away from the center of most values.
The mode can be used for nominal data because it identifies the category that occurs most often. The mean and median are not appropriate for unordered nominal categories.
Central tendency describes the center of the data, while dispersion describes how widely the observations are spread around that center. Common measures of dispersion include the range, variance, standard deviation, and interquartile range.
